Fig. 1
Download original image
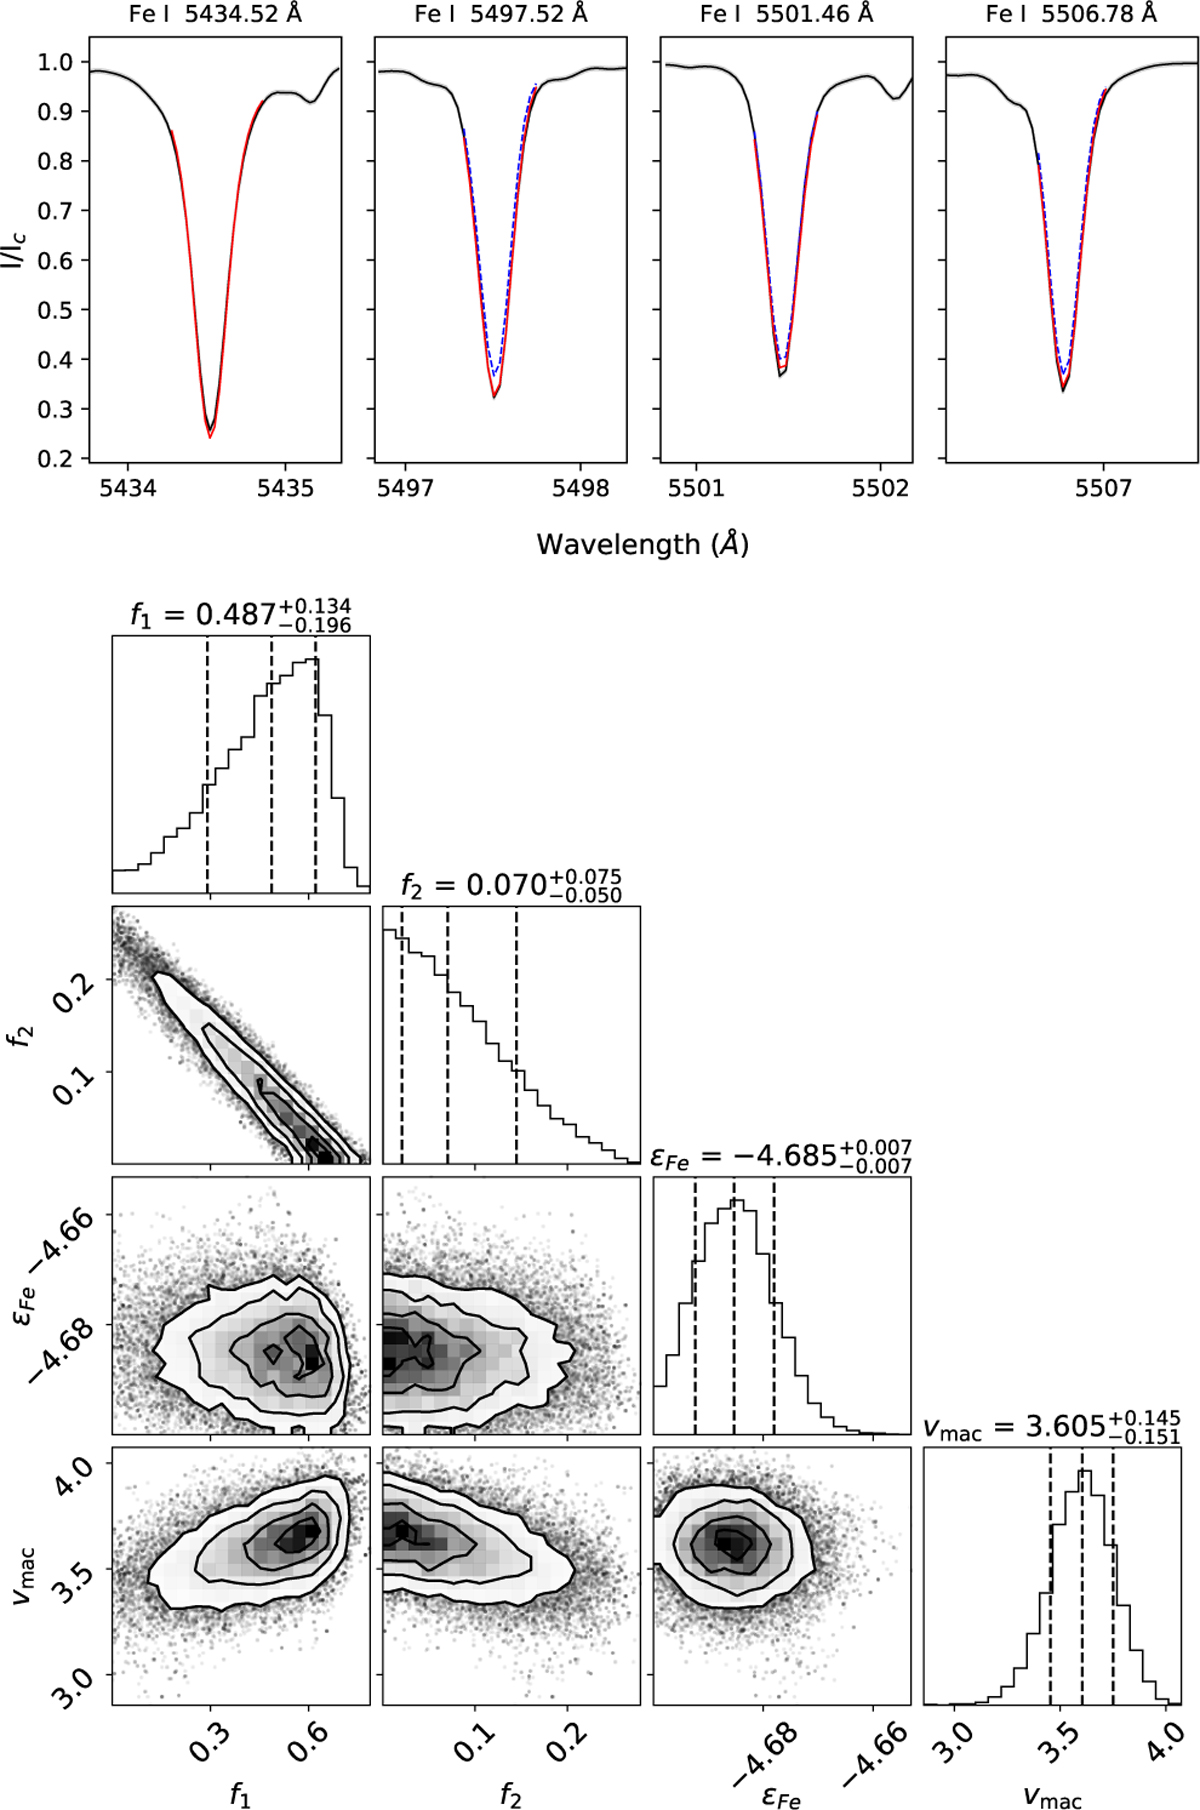
Top. spectral lines used for magnetic inference in the optical. This plot shows the epoch-averaged NARVAL spectra in black with the best fit synthetic spectra in red and the non-magnetic counterpart with otherwise identical stellar parameters in dashed-blue. Bottom: corner plot showing the posterior distributions for the parameters used in the MCMC analysis.
Current usage metrics show cumulative count of Article Views (full-text article views including HTML views, PDF and ePub downloads, according to the available data) and Abstracts Views on Vision4Press platform.
Data correspond to usage on the plateform after 2015. The current usage metrics is available 48-96 hours after online publication and is updated daily on week days.
Initial download of the metrics may take a while.