Fig. 8.
Download original image
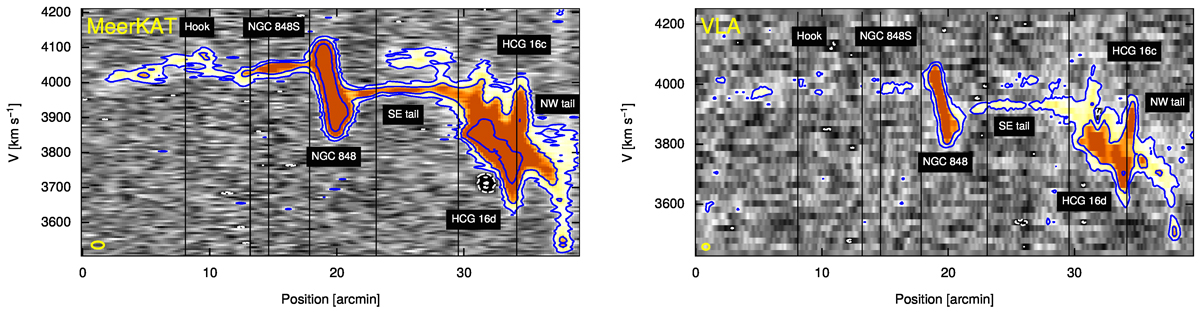
Segmented position-velocity diagrams of HCG 16 taken from the paths shown in Figure 7. Left panel: MeerKAT data from this paper. Right panel: VLA data from Jones et al. (2019). Blue contours show emission at 3× the rms noise. Dashed lines show negative contours. The vertical black lines indicate the positions of the nodes that make up the slices from which the position velocity diagrams where taken. The yellow ellipses at the bottom left corner of each panels show the half-power beam width ![]() and 20 km s−1 velocity width.
and 20 km s−1 velocity width.
Current usage metrics show cumulative count of Article Views (full-text article views including HTML views, PDF and ePub downloads, according to the available data) and Abstracts Views on Vision4Press platform.
Data correspond to usage on the plateform after 2015. The current usage metrics is available 48-96 hours after online publication and is updated daily on week days.
Initial download of the metrics may take a while.