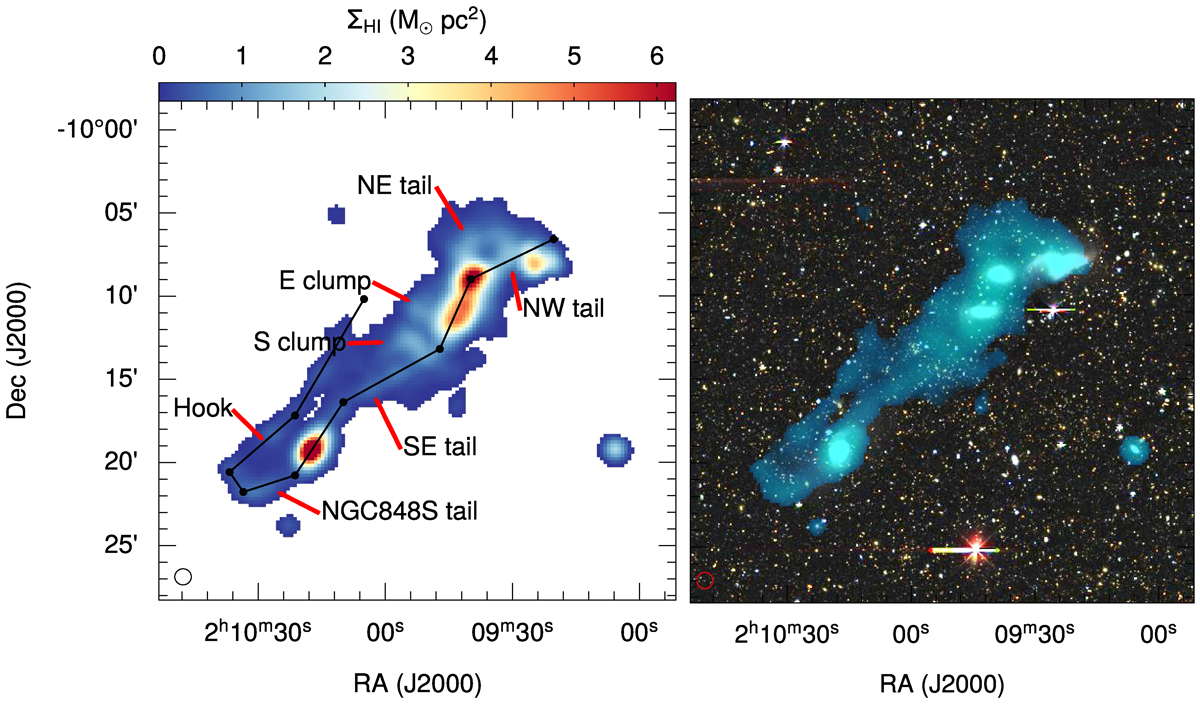
Fig. 7.
Download original image
Left panel: MeerKAT H I surface density map of HCG 16 showing the paths (black lines) from which the segmented position-velocity diagrams shown in Figure 8 are taken. The black circles show the positions of the nodes that make up the different slices. Right panel: Same moment zero map overplotted on DECaLS optical images to highlight the core members.
Current usage metrics show cumulative count of Article Views (full-text article views including HTML views, PDF and ePub downloads, according to the available data) and Abstracts Views on Vision4Press platform.
Data correspond to usage on the plateform after 2015. The current usage metrics is available 48-96 hours after online publication and is updated daily on week days.
Initial download of the metrics may take a while.