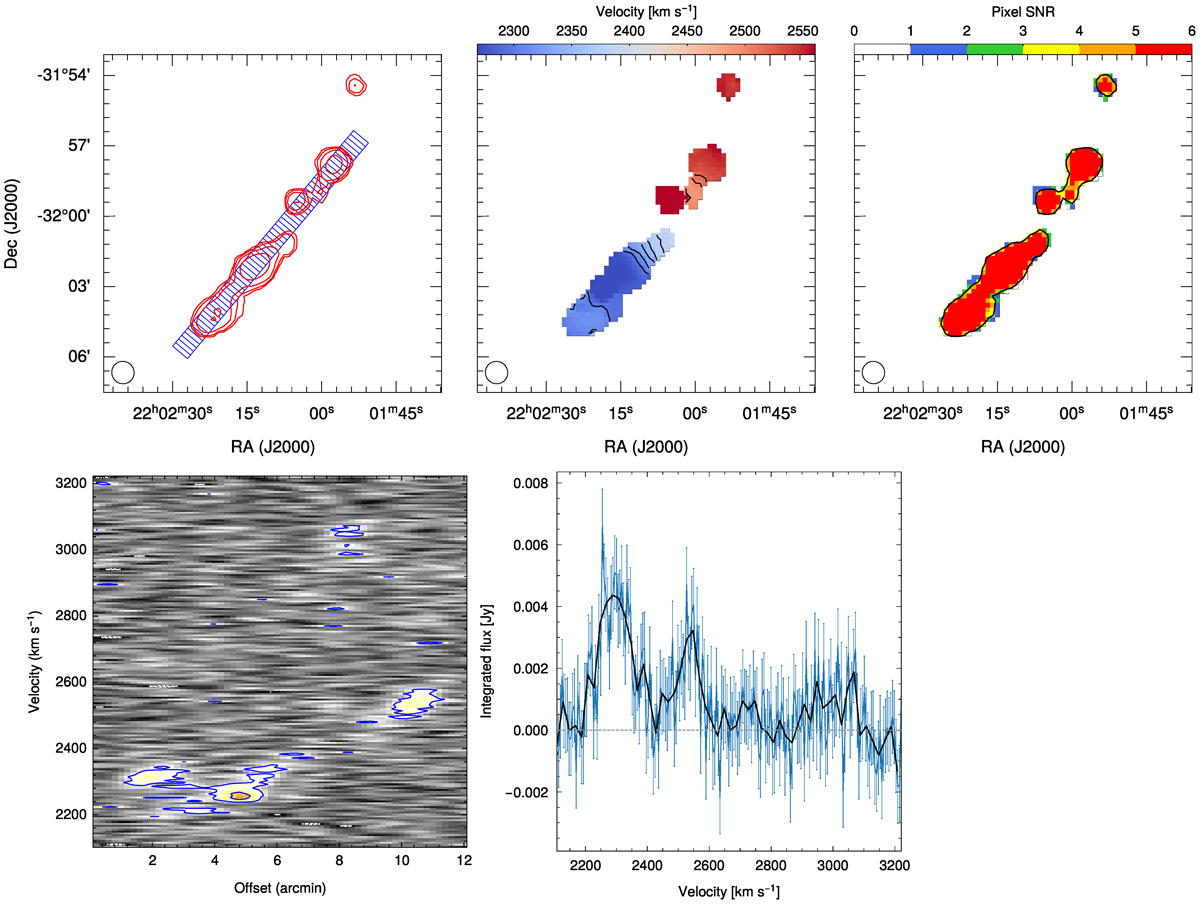
Fig. D.4.
Download original image
Top left: H I column density map of the tails of HCG 90. The contour levels are (0.35, 0.69, 1.38, 2.77) × 1019 cm−2. The blue area indicates the slice from which the position-velocity diagram shown at the bottom panel was derived. Top centre: Moment-1 map, the contour levels are (2300, 2320, 2340, 2360, 2380, 2400, 2420, 2440, 2460, 2480, 2500, 2520) km s−1. Top right: Signal-to-noise ratio map. Pixels above 6-σ are all shown in red. The black contour represent the lowest column density contour plotted at the top left panel of the figure. Bottom left: Position-velocity diagram taken from the slice shown at the top right panel. Bottom right: Global H I profile. The black line is a smoothed version of the profile using at 20 km s−1 velocity resolution.
Current usage metrics show cumulative count of Article Views (full-text article views including HTML views, PDF and ePub downloads, according to the available data) and Abstracts Views on Vision4Press platform.
Data correspond to usage on the plateform after 2015. The current usage metrics is available 48-96 hours after online publication and is updated daily on week days.
Initial download of the metrics may take a while.