Fig. D.2.
Download original image
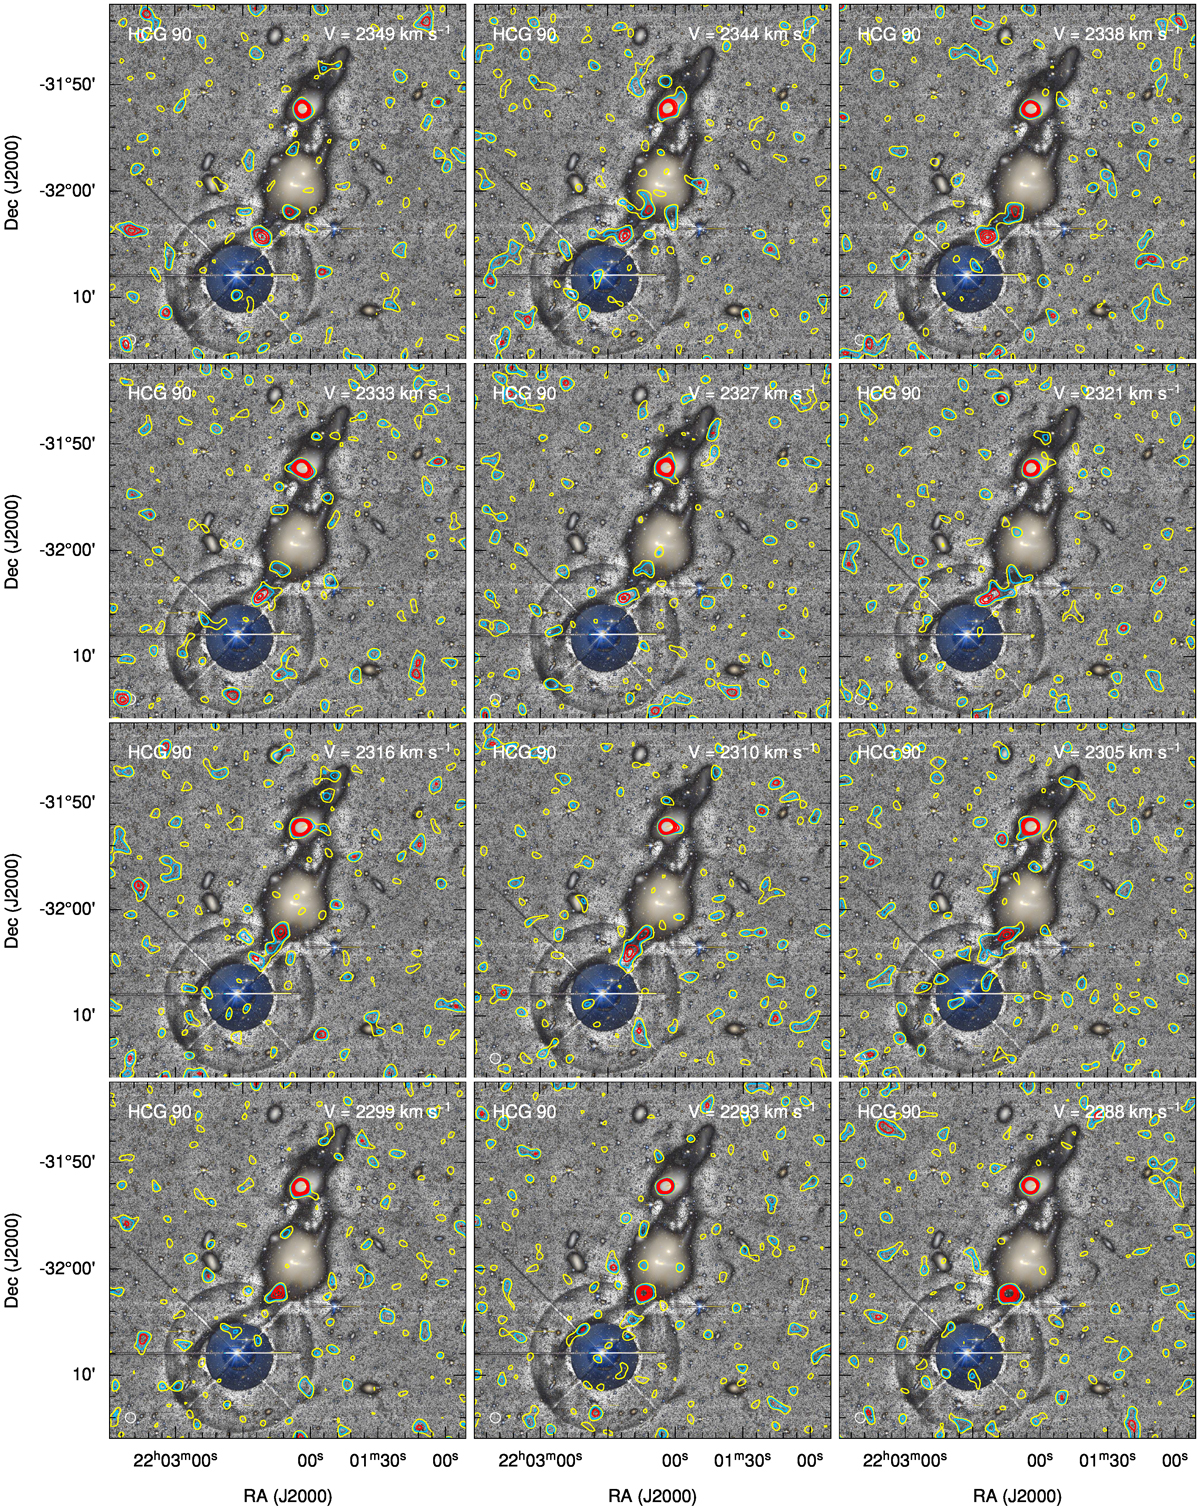
Example channel maps of the primary beam corrected cube of HCG 90 overlaid on enhanced DECaLS optical images. To improve the signal-to-noise ratio of the optical data and highlight the optical tail, we have added G-band and R-band images and aligned the pixel scale to 8×8 (0.27×8 arcsec). Contour levels are (1.5, 2, 3, 4, 5, 6) times the median noise level in the cube (0.66 mJy beam−1). The yellow and green colours show contour levels below 3σ. The red colours represent contour levels at 3σ or higher. Additional figures can be downloaded here.
Current usage metrics show cumulative count of Article Views (full-text article views including HTML views, PDF and ePub downloads, according to the available data) and Abstracts Views on Vision4Press platform.
Data correspond to usage on the plateform after 2015. The current usage metrics is available 48-96 hours after online publication and is updated daily on week days.
Initial download of the metrics may take a while.