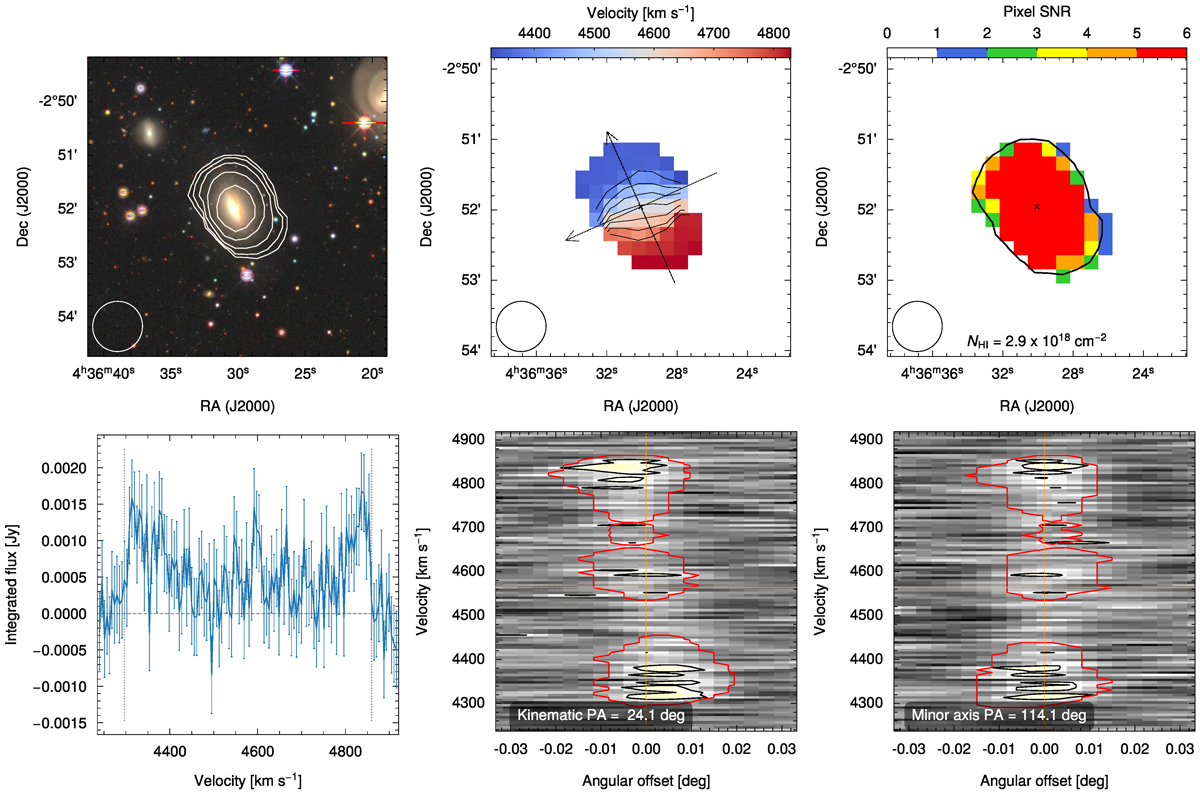
Fig. C.5.
Download original image
Top left: H I column density map overlaid on DECaLS optical image of HCG 30b. The contour levels are (0.29, 0.57, 1.14, 2.28, 4.57) × 1019 cm−2. Top centre: Moment-1 map, the contour levels are (4384, 4444, 4504, 4564, 4624, 4684, 4744) km s−1. The arrows indicate the slices from which the position-velocity diagrams shown at the bottom panels were derived. Top right: Signal-to-noise ratio map. Bottom left: Global H I profile. Bottom centre: Major axis position-velocity diagram. Bottom right: Minor axis position-velocity diagram.
Current usage metrics show cumulative count of Article Views (full-text article views including HTML views, PDF and ePub downloads, according to the available data) and Abstracts Views on Vision4Press platform.
Data correspond to usage on the plateform after 2015. The current usage metrics is available 48-96 hours after online publication and is updated daily on week days.
Initial download of the metrics may take a while.