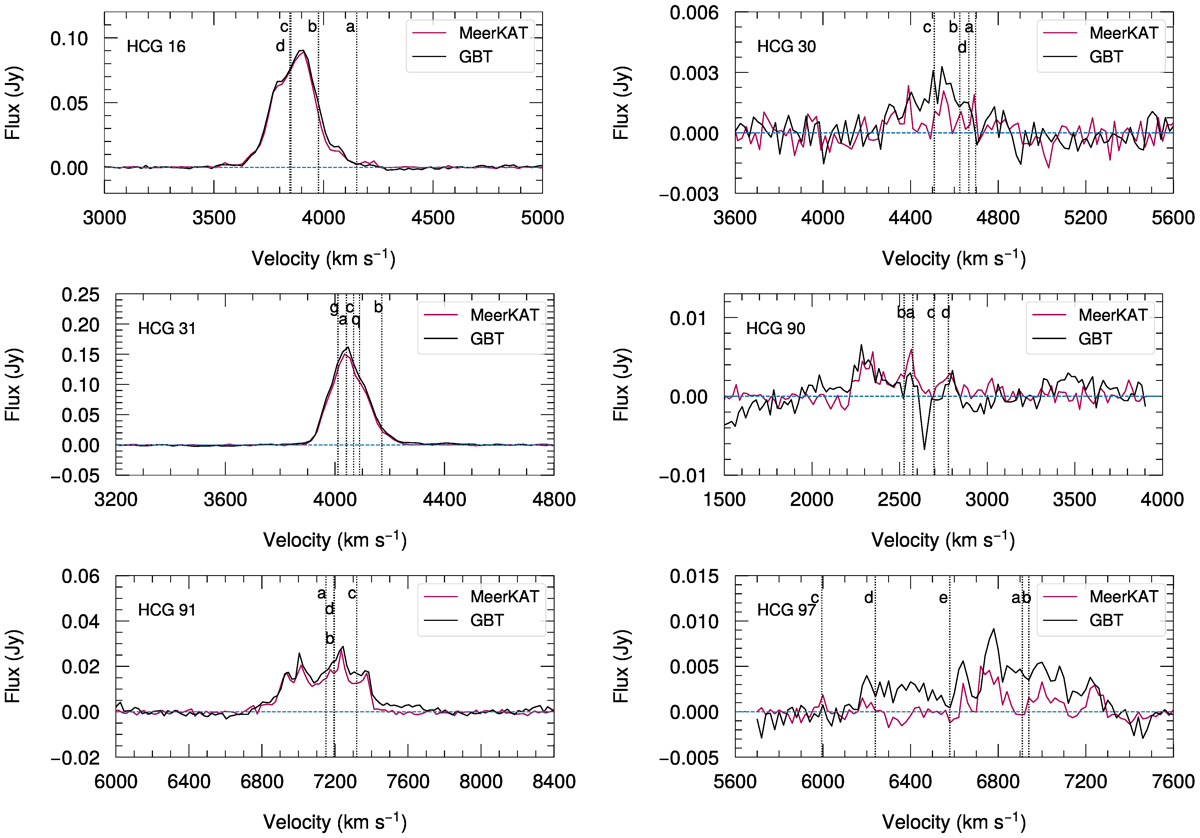
Fig. 2.
Download original image
GBT versus MeerKAT integrated spectrum smoothed at 20 Jy km s−1. The pink solid lines indicate the MeerKAT integrated spectra. The solid black lines indicate the GBT spectra of Borthakur et al. (2010). The vertical dotted lines indicate the velocities of the galaxies in the core of each group. The horizontal blue lines indicate zero intensity values to guide the eyes.
Current usage metrics show cumulative count of Article Views (full-text article views including HTML views, PDF and ePub downloads, according to the available data) and Abstracts Views on Vision4Press platform.
Data correspond to usage on the plateform after 2015. The current usage metrics is available 48-96 hours after online publication and is updated daily on week days.
Initial download of the metrics may take a while.