Fig. B.3.
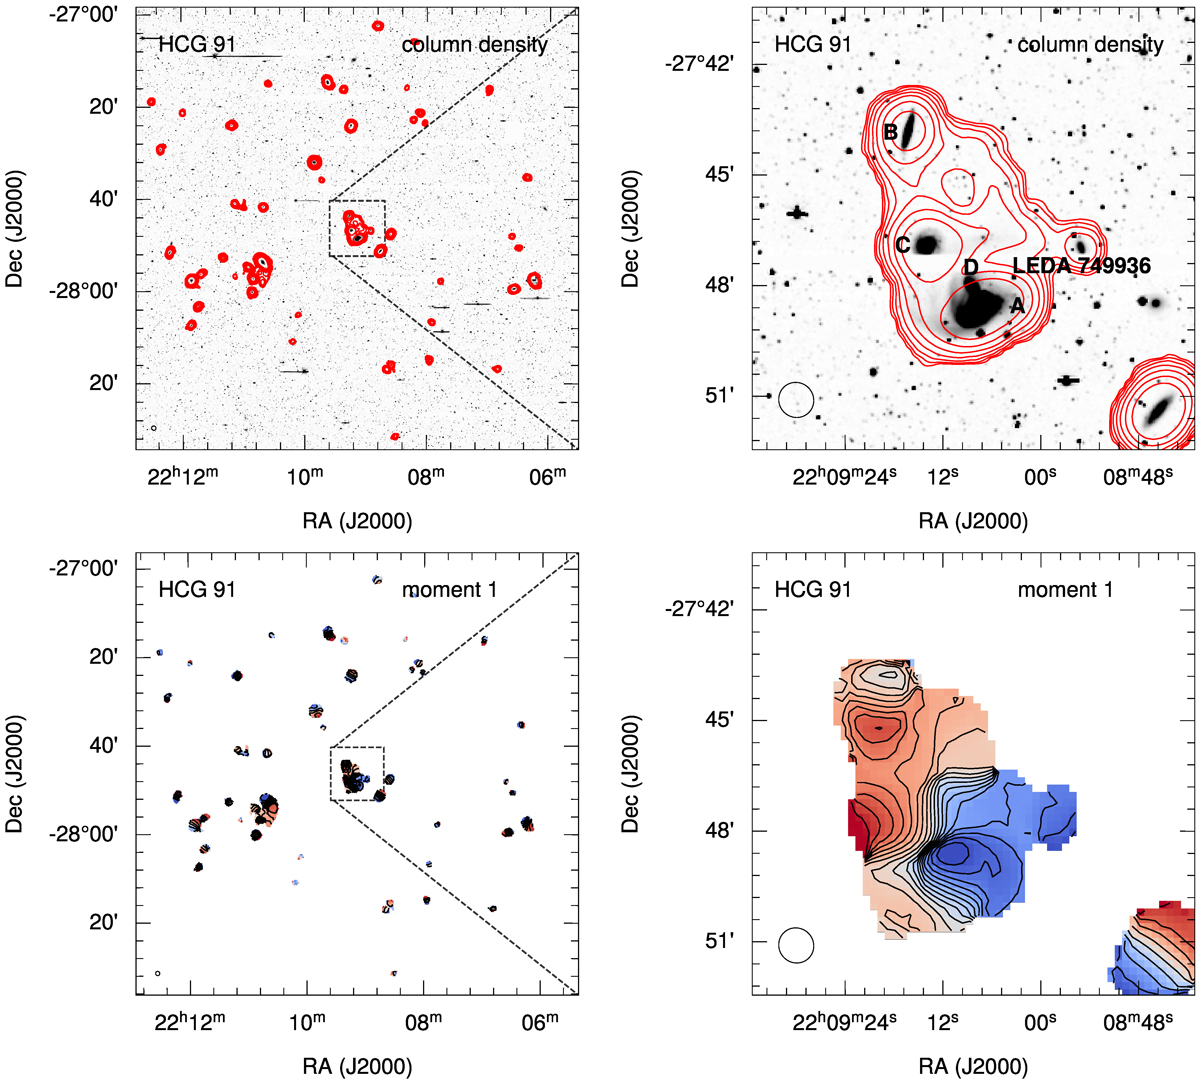
Download original image
H I moment maps of HCG 91. The left panels show all sources detected by SoFiA. The right panels show sources within the rectangular box shown on the left to better show the central part of the group. The top panels show the column density maps with contour levels of (4.6 × 10¹⁸, 9.2 × 10¹⁸, 1.8 × 10¹⁹, 3.7 × 10¹⁹, 7.4 × 10¹⁹, 1.5 × 10²⁰, 3.0 × 10²⁰) cm−2. The contours are overlaid on DECaLS DR10 I-band optical images. The bottom panels show the moment one map. Each individual source has its own colour scaling and contour levels to highlight any rotational component.
Current usage metrics show cumulative count of Article Views (full-text article views including HTML views, PDF and ePub downloads, according to the available data) and Abstracts Views on Vision4Press platform.
Data correspond to usage on the plateform after 2015. The current usage metrics is available 48-96 hours after online publication and is updated daily on week days.
Initial download of the metrics may take a while.