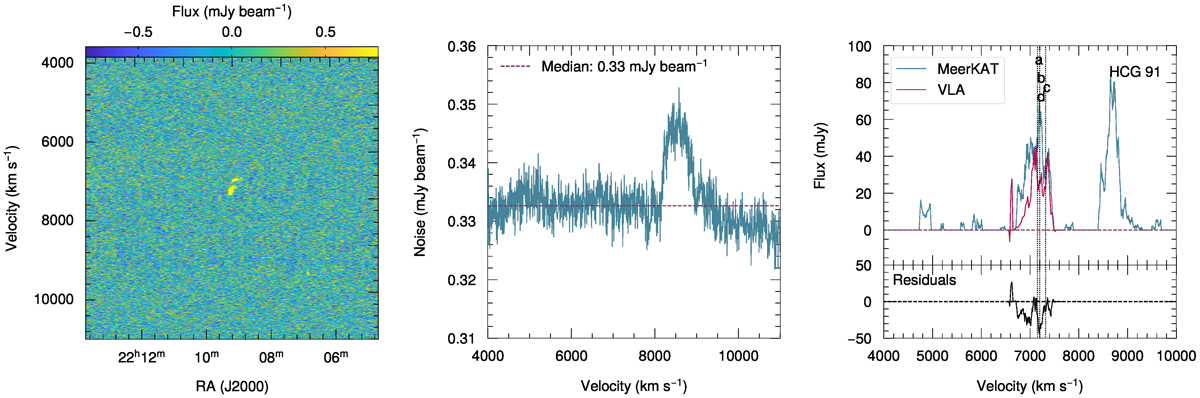
Fig. B.1.
Download original image
Left panel: Velocity versus right ascension of HCG 91. Middle panel: Median noise values of each RA-DEC slice of the non-primary beam corrected 60″ data cube of HCG 91 as a function of velocity. The horizontal dashed line indicates the median of all the noise values from each slice. Right panel: Integrated spectra; the blue solid line indicates the MeerKAT integrated spectrum of HCG 91; the red solid line indicates VLA integrated spectrum of the group derived by (Jones et al. 2023). The vertical dotted lines indicate the velocities of the galaxies in the core of the group. The spectra have been extracted from areas containing only genuine H I emission.
Current usage metrics show cumulative count of Article Views (full-text article views including HTML views, PDF and ePub downloads, according to the available data) and Abstracts Views on Vision4Press platform.
Data correspond to usage on the plateform after 2015. The current usage metrics is available 48-96 hours after online publication and is updated daily on week days.
Initial download of the metrics may take a while.