Fig. 1.
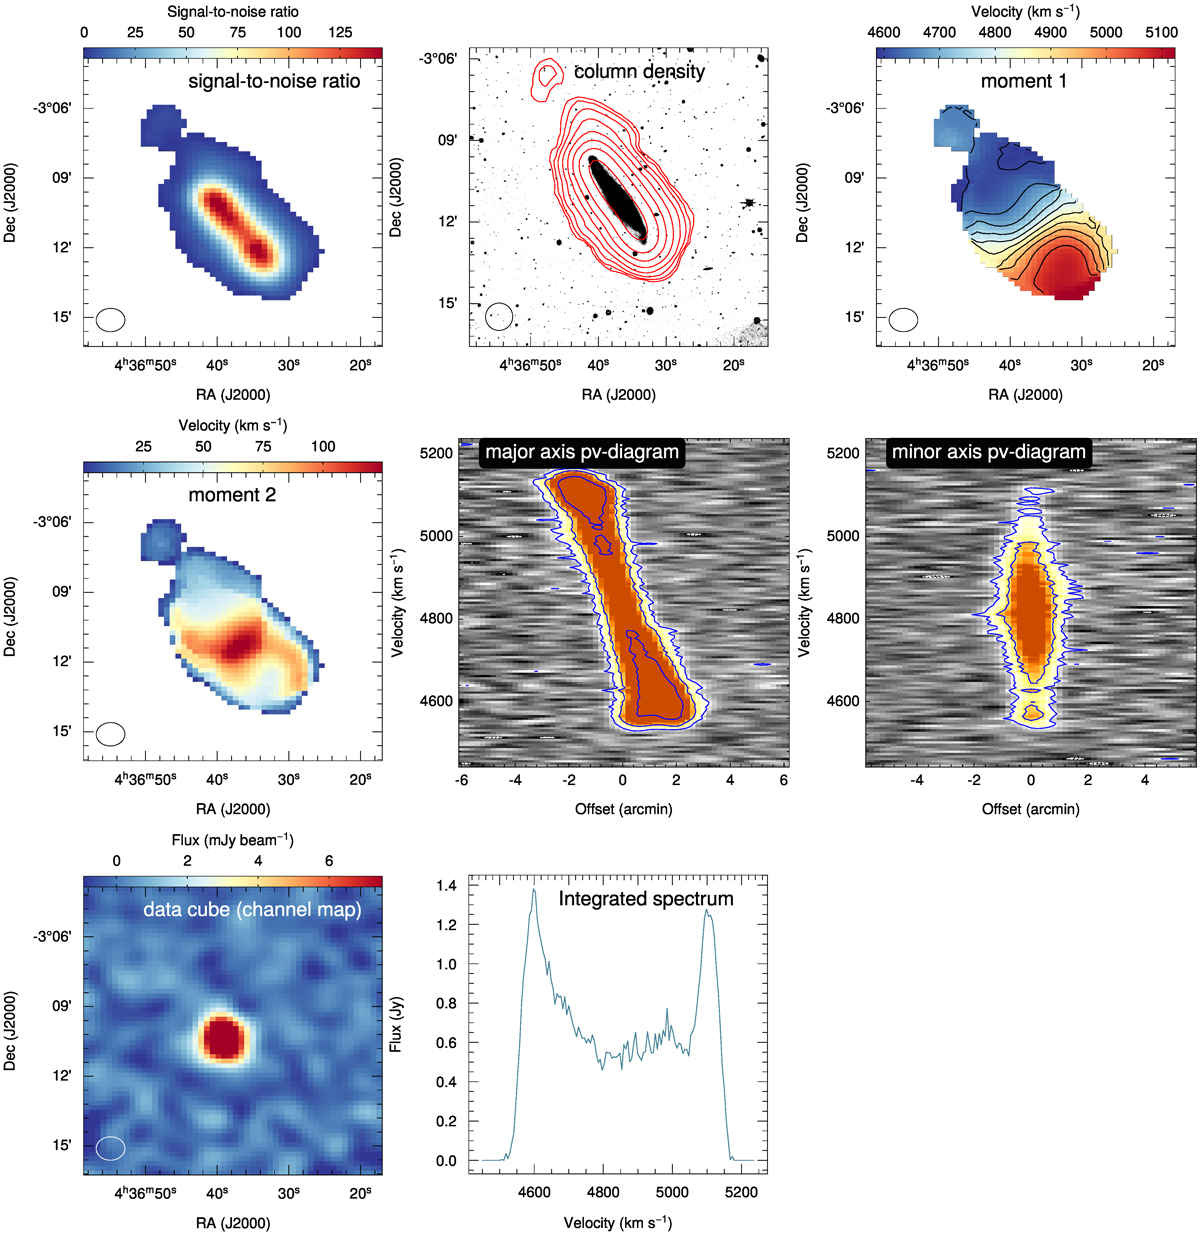
Download original image
Example SoFiA data products for NGC 1622; a spiral galaxy previously detected in H I located at about 381 kpc southeast from the group centre. From top-left to bottom-right panel: Signal-to-noise ratio of each individual pixels; column density map and R-band DeCaLS DR10 (Dey et al. 2019) optical image – the contour levels are (5.70 × 10¹⁸, 1.140 × 10¹⁹, 2.28 × 10¹⁹, 4.56 × 10¹⁹, 9.12 × 10¹⁹, 1.82 × 10²⁰, 3.65 × 10²⁰, 7.30 × 10²⁰) cm−2; first moment map (velocity field); second moment map; major axis position velocity diagram; minor axis position velocity diagram; an example channel map; and integrated spectrum from a data cube where the noise has been masked. The ellipse at the bottom left corner of each plot shows the beam, 43.8″ × 47.5″.
Current usage metrics show cumulative count of Article Views (full-text article views including HTML views, PDF and ePub downloads, according to the available data) and Abstracts Views on Vision4Press platform.
Data correspond to usage on the plateform after 2015. The current usage metrics is available 48-96 hours after online publication and is updated daily on week days.
Initial download of the metrics may take a while.