Fig. 8.
Download original image
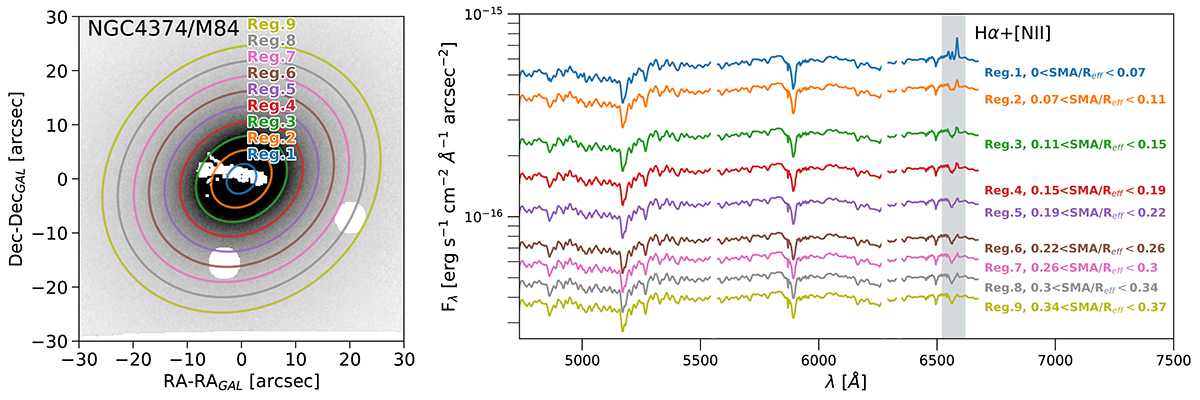
Left panel: Slice of MUSE cube at λ ∼ 5400 Å for M84. The white spaxels indicate masked regions either representing dust or background/foreground sources. The superimposed coloured ellipses are the isophotes defined from the i images. The number of the regions is indicated. Right panel: MUSE spectra representing the sum of the flux for each elliptical annulus from the left panel. The grey shaded areas indicate the Hα + [NII] lines, while regions due to sky and telluric residuals are omitted. See text for more details.
Current usage metrics show cumulative count of Article Views (full-text article views including HTML views, PDF and ePub downloads, according to the available data) and Abstracts Views on Vision4Press platform.
Data correspond to usage on the plateform after 2015. The current usage metrics is available 48-96 hours after online publication and is updated daily on week days.
Initial download of the metrics may take a while.