Open Access
Fig. E.1.
Download original image
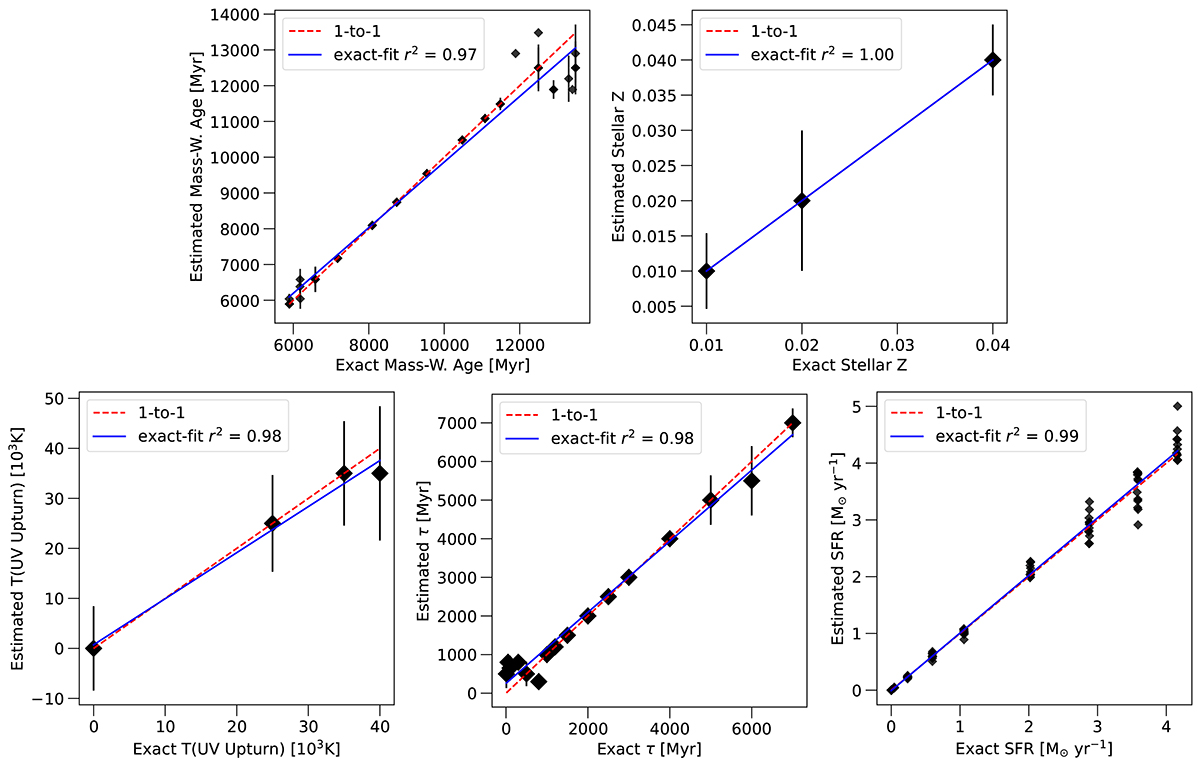
Median estimated galaxy parameters as a function of the generated parameters for the mock galaxies. Errors are the 1σ of the distribution. The dashed red line indicates the 1−to−1 relation, while the blue solid line represents a linear fit to the data. The squared Pearson correlation coefficient r2 is reported.
Current usage metrics show cumulative count of Article Views (full-text article views including HTML views, PDF and ePub downloads, according to the available data) and Abstracts Views on Vision4Press platform.
Data correspond to usage on the plateform after 2015. The current usage metrics is available 48-96 hours after online publication and is updated daily on week days.
Initial download of the metrics may take a while.