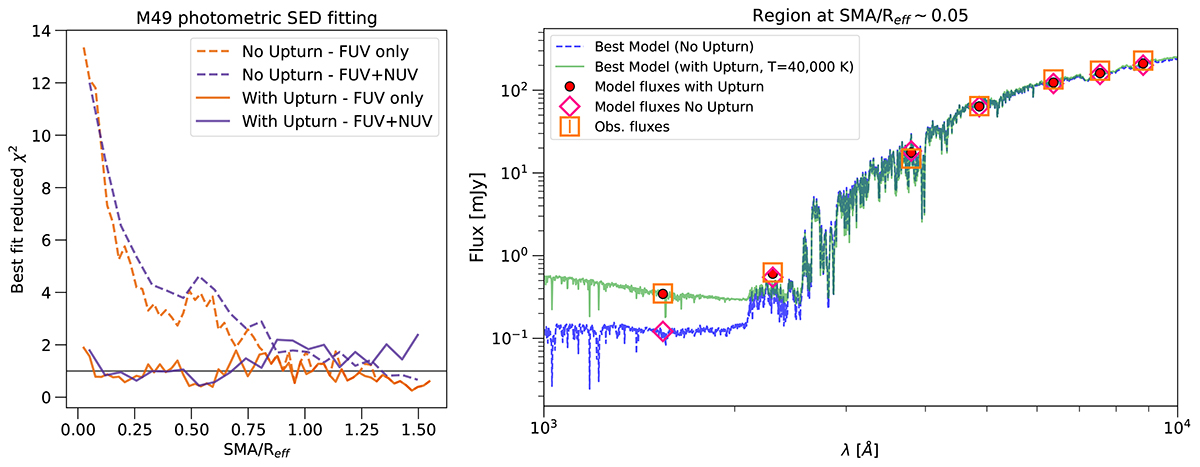
Fig. 12.
Download original image
Left panel: Reduced χ2 values from CIGALE best fit as a function of SMA/Reff for M49. Solid (dashed) lines indicate fits performed with (without) an UV upturn component, while orange (purple) lines represent fits performed on FUV+optical (FUV+NUV+optical) broadband data. The grey horizontal solid line marks a reduced χ2 = 1. Right panel: M49 photometric FUV+NUV+optical SED fitting. Open orange squares are the observed fluxes for the region at SMA/Reff ∼ 0.05. The blue dashed line is the best model found by CIGALE when the data are fitted with no Upturn models, while the green solid line is the best fit by considering the upturn component. Red filled circles and pink open diamonds are the model fluxes for the upturn and no-upturn models, respectively.
Current usage metrics show cumulative count of Article Views (full-text article views including HTML views, PDF and ePub downloads, according to the available data) and Abstracts Views on Vision4Press platform.
Data correspond to usage on the plateform after 2015. The current usage metrics is available 48-96 hours after online publication and is updated daily on week days.
Initial download of the metrics may take a while.