Fig. 5.
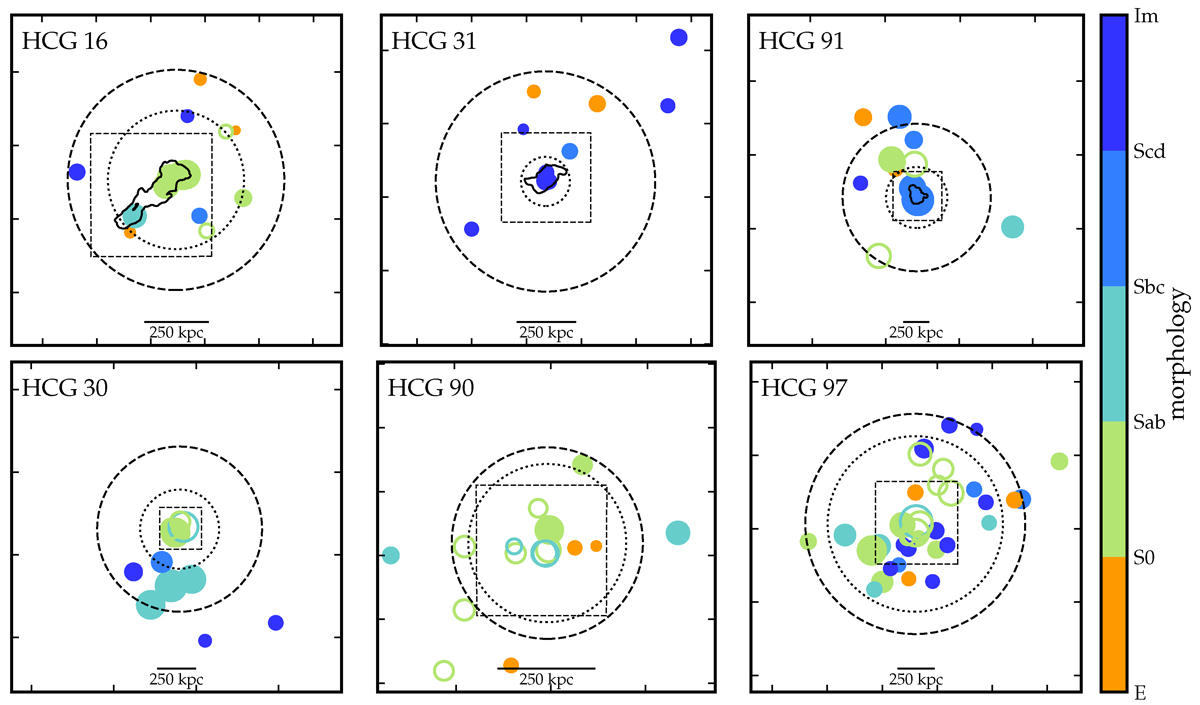
Download original image
Morphology distribution in and around the HCGs. In the phase 2 groups (top panels) are shown the outermost contours of Fig. 2. The dashed box corresponds to the area covered in Fig. 2 and the dotted and dashed circles show respectively the virial radius rvir and the 30′ FWHM of MeerKAT. The size of the symbols is proportional to the stellar mass. Filled symbols represent sources detected in H I, while open circles are non-detections.
Current usage metrics show cumulative count of Article Views (full-text article views including HTML views, PDF and ePub downloads, according to the available data) and Abstracts Views on Vision4Press platform.
Data correspond to usage on the plateform after 2015. The current usage metrics is available 48-96 hours after online publication and is updated daily on week days.
Initial download of the metrics may take a while.