Fig. 4.
Download original image
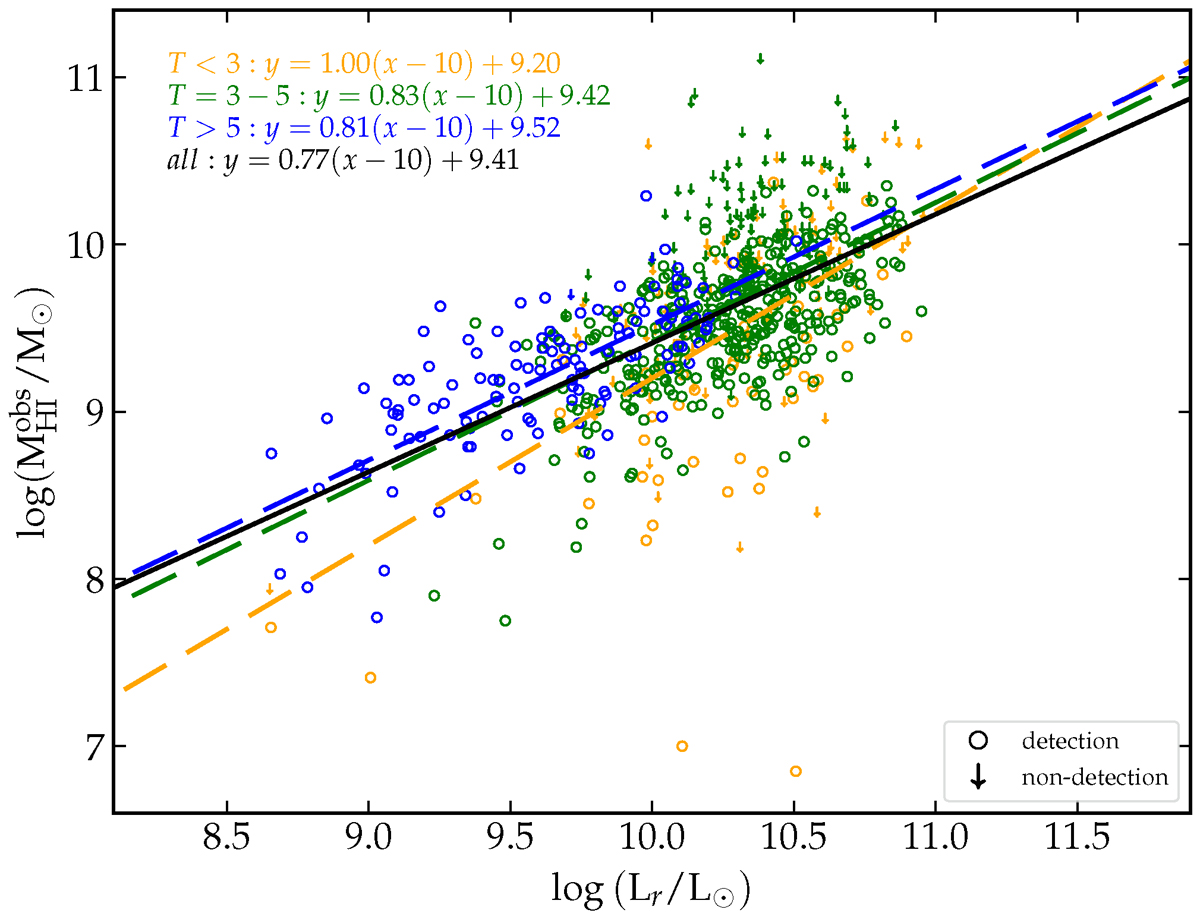
Predicted H I mass as a function of r-band luminosity of the AMIGA galaxies. The open symbols represent the measured H I masses while the downward arrows denote galaxies for which upper limit masses were considered. The sample is divided into morphology bins, whose fits are shown in dashed lines of corresponding colours. The fit of the overall sample is given by the solid black line.
Current usage metrics show cumulative count of Article Views (full-text article views including HTML views, PDF and ePub downloads, according to the available data) and Abstracts Views on Vision4Press platform.
Data correspond to usage on the plateform after 2015. The current usage metrics is available 48-96 hours after online publication and is updated daily on week days.
Initial download of the metrics may take a while.