Open Access
Fig. 3.
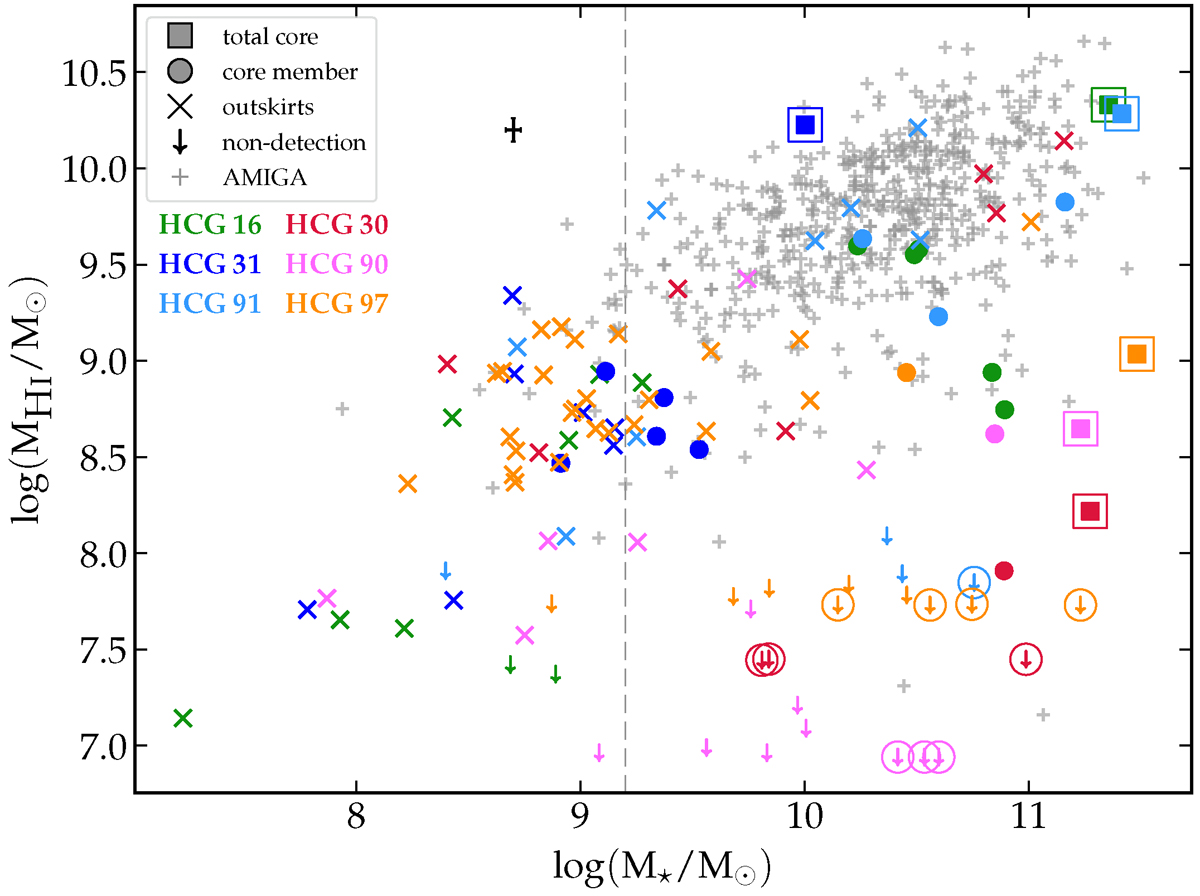
Download original image
H I-stellar mass relation of the galaxies in the compact group regions (colour symbols) and of the isolated galaxies of the AMIGA sample (grey crosses). The vertical dashed line at 9.2 dex shows the lower mass limit of the AMIGA galaxies.
Current usage metrics show cumulative count of Article Views (full-text article views including HTML views, PDF and ePub downloads, according to the available data) and Abstracts Views on Vision4Press platform.
Data correspond to usage on the plateform after 2015. The current usage metrics is available 48-96 hours after online publication and is updated daily on week days.
Initial download of the metrics may take a while.