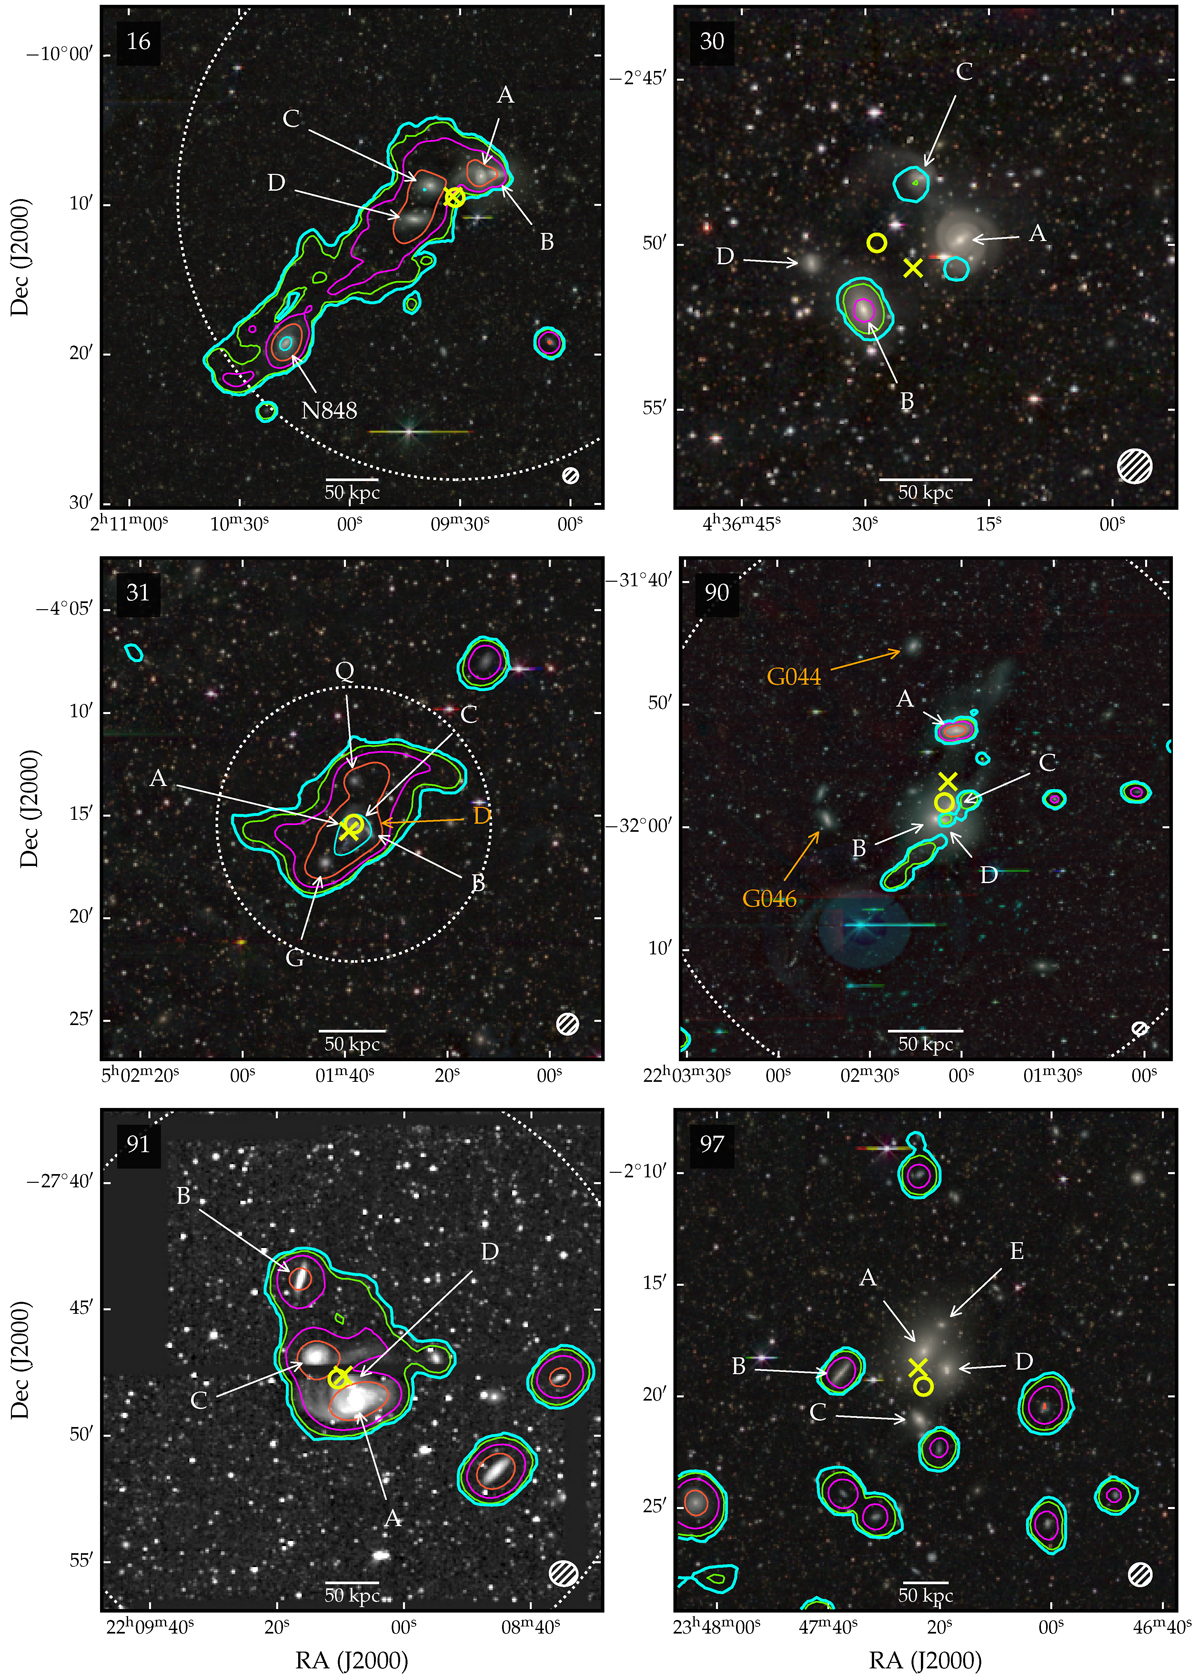
Fig. 2.
Download original image
H I contours of the central regions of the phase 2 (left) and 3 (right) HCGs overlaid on their optical grz colour images from DECaLS (except for HCG 91 where the only DECaLS g-band image is shown). The contours are at NH I,3σ × 22n, with NH I,3σ given in Table 2 and n = 0, 1, 2, 3, respectively, for the cyan, green, magenta, and orange contours. The core galaxies are labelled with white letters, and the yellow circle and cross, respectively, show the NED and calculated positions of the group centres. The objects G044 and G046 in HCG 90’s panel correspond respectively to ESO466-G044 and ESO466-G046 (see Sect. 3.3 for details). The dotted circle shows the group’s virial radius where it can be seen. The HCG number is given in the upper left corner of each panel and the synthesised H I beam is represented by a hatched ellipse in the lower right corner.
Current usage metrics show cumulative count of Article Views (full-text article views including HTML views, PDF and ePub downloads, according to the available data) and Abstracts Views on Vision4Press platform.
Data correspond to usage on the plateform after 2015. The current usage metrics is available 48-96 hours after online publication and is updated daily on week days.
Initial download of the metrics may take a while.