Fig. 9
Download original image
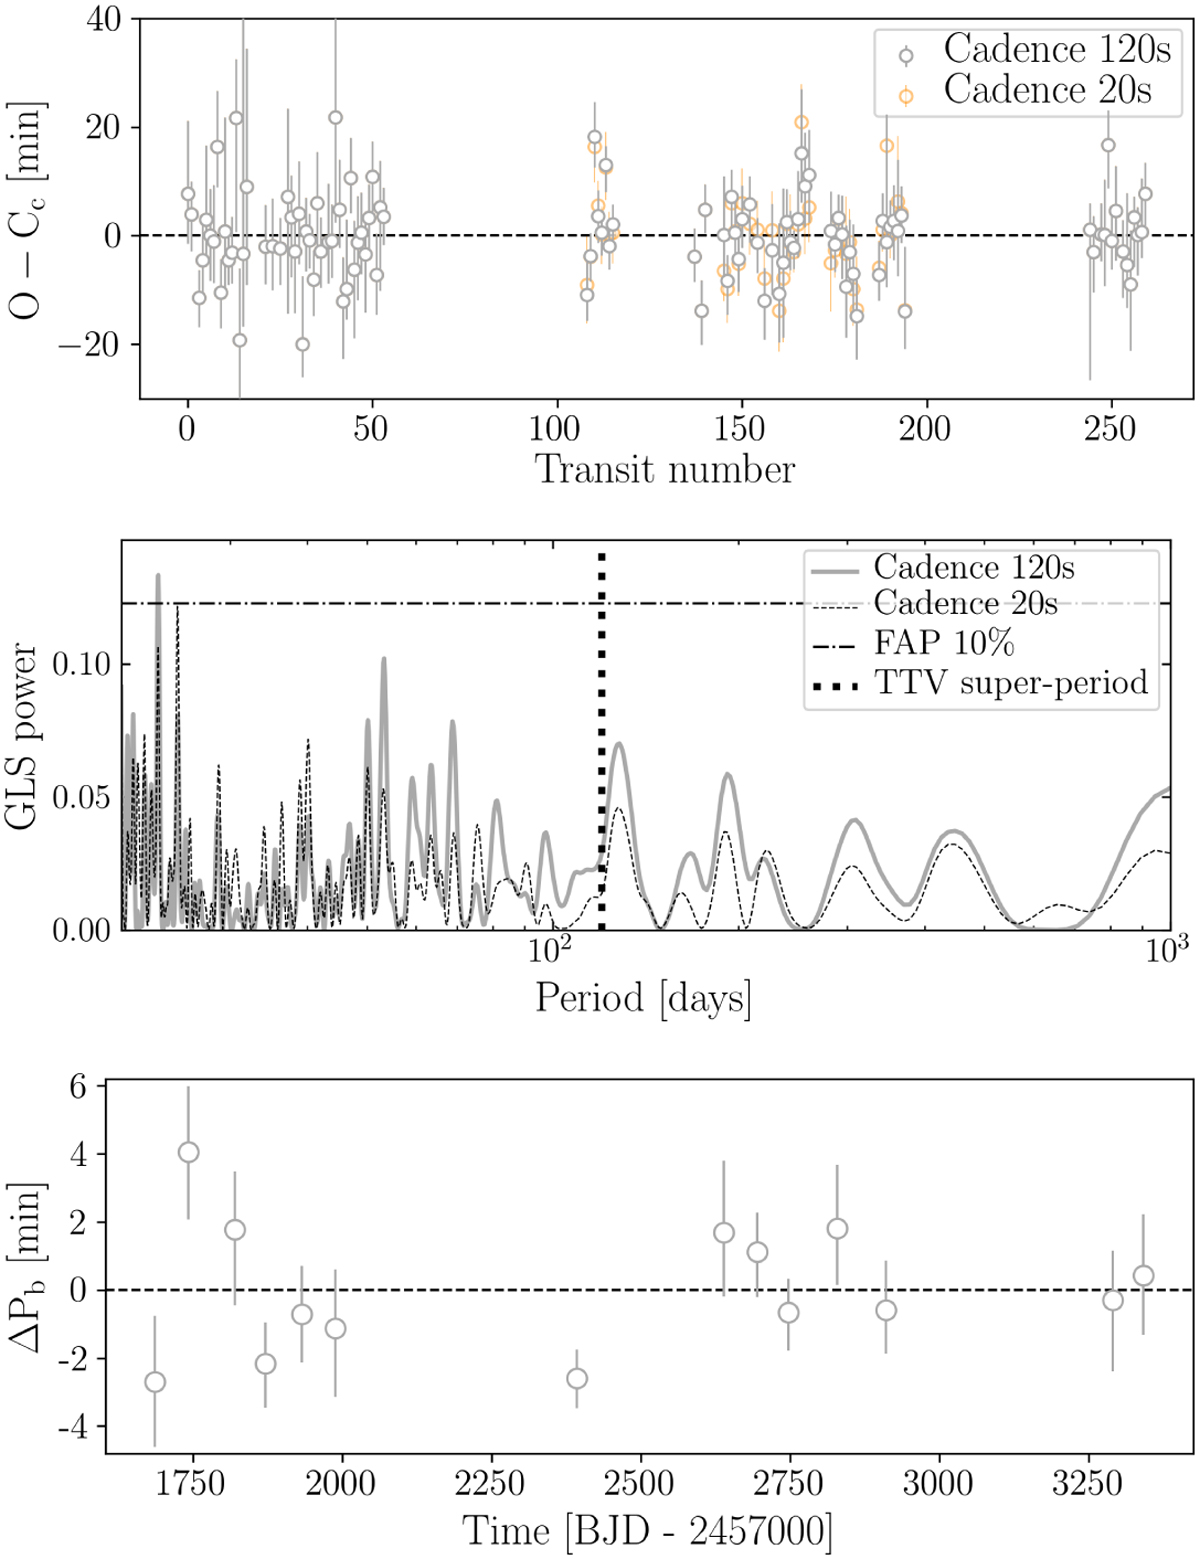
TTV searches in the TESS LCs. The top plot shows the O- C diagram of the individual transits of planet c, and the middle panel presents the GLS periodogram of those observations. The solid line is the periodogram derived from all the 2 min cadence data. The dashed line was obtained after replacing the 2 min by 20s cadence data when available, and proceeding to new transit fits (cf. the orange points in the top plot). We do not find significant periodicity. The bottom plot presents the variation of the orbital period of planet b as measured from pairs of consecutive sectors (with 2 min cadence).
Current usage metrics show cumulative count of Article Views (full-text article views including HTML views, PDF and ePub downloads, according to the available data) and Abstracts Views on Vision4Press platform.
Data correspond to usage on the plateform after 2015. The current usage metrics is available 48-96 hours after online publication and is updated daily on week days.
Initial download of the metrics may take a while.