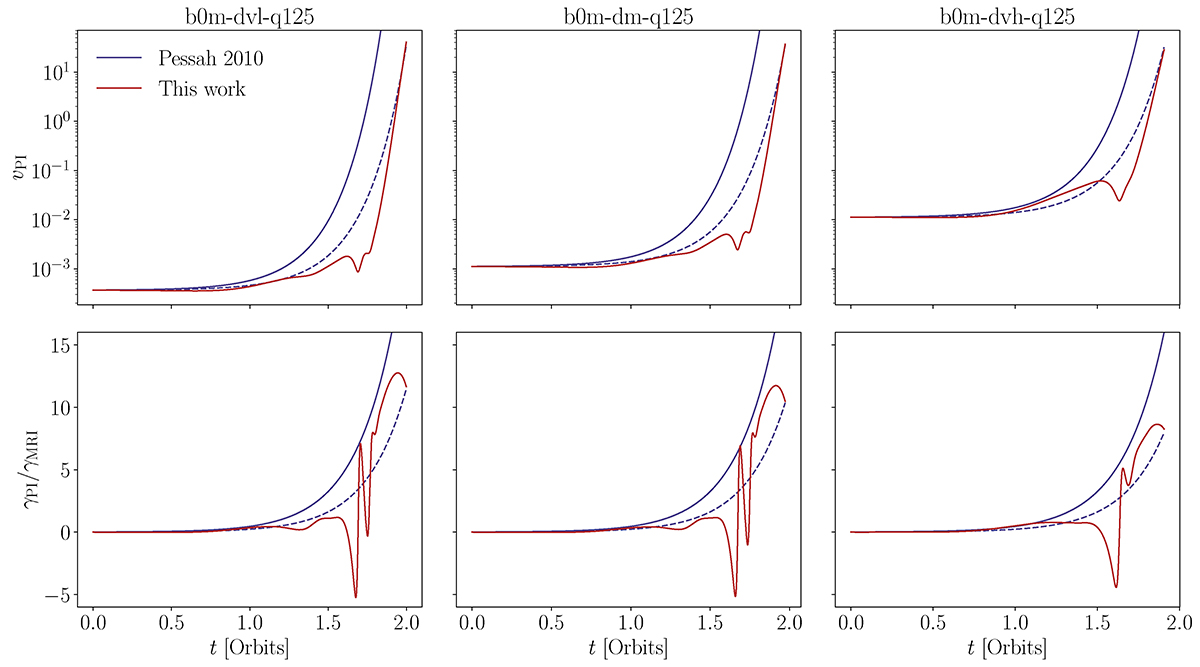
Fig. 6.
Download original image
Top panels: time evolution of the parasitic velocity for different initial amplitudes of the PIs (from left to right, v0 = {0.112, 1.12, 11.2}×10−3) and a fixed initial MRI field, B0 = 3.33 × 10⁻². The solid blue lines refer to the evolution of the parasitic velocity given in Eq. (40), whereas the red lines correspond to our approach. The dashed blue lines refer to the same velocity from Eq. (40), but adding the correcting factor f to the parasitic growth rate from Eq. (39). Bottom panels: time evolution of the normalized parasitic growth rate. Adding the correcting factor f to the expression from Eq. (39) (dashed blue lines), the parasitic growth rate roughly agrees with the one we obtain in our study (solid red lines).
Current usage metrics show cumulative count of Article Views (full-text article views including HTML views, PDF and ePub downloads, according to the available data) and Abstracts Views on Vision4Press platform.
Data correspond to usage on the plateform after 2015. The current usage metrics is available 48-96 hours after online publication and is updated daily on week days.
Initial download of the metrics may take a while.