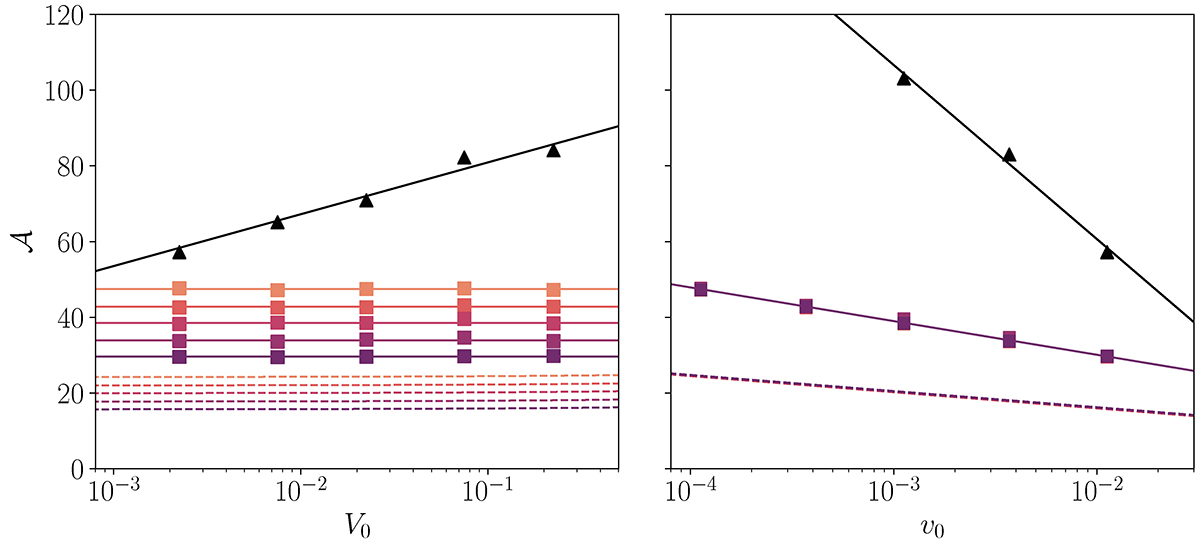
Fig. 5.
Download original image
Left panel: dependence of the amplification factor, defined in Eq. (34), on the amplitude of the initial MRI velocity field, V0. Right panel: dependence of the amplification factor on the initial PI velocity field, v0. We use the runs from Table C.2 (solid lines with squares). Each color represents a different initial PI amplitude, v0, where the darker colors stand for larger values of v0. The solid lines represent the fit from Eq. (45). The dashed lines stand for the amplification factor computed with Eq. (42), i.e., assuming no background shear. The black triangles correspond to the results from the numerical simulations of Rembiasz et al. (2016b), and the black solid line is the linear fit from Eq. (47).
Current usage metrics show cumulative count of Article Views (full-text article views including HTML views, PDF and ePub downloads, according to the available data) and Abstracts Views on Vision4Press platform.
Data correspond to usage on the plateform after 2015. The current usage metrics is available 48-96 hours after online publication and is updated daily on week days.
Initial download of the metrics may take a while.