Fig. 4.
Download original image
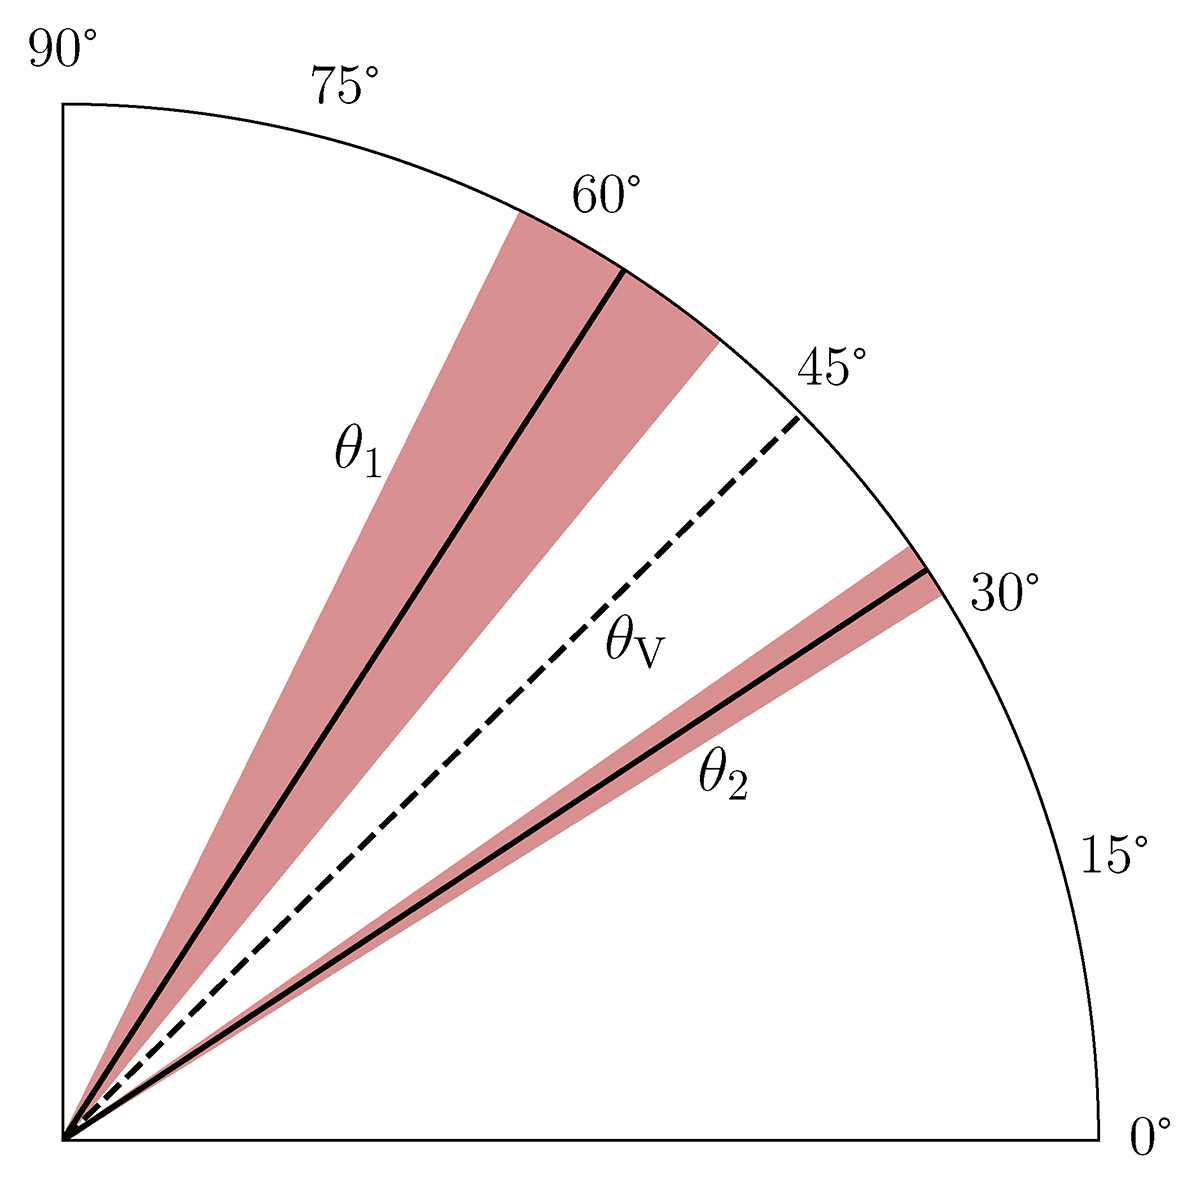
Values of the angle θ for which the PIs grow super-exponentially. The rapid increase of the secondary modes occurs between θ1 and θ2, depicted with solid black lines. These lines correspond to the mean value of these angles for the runs from Table C.1. The red-shaded regions represent the 1-σ deviation. The black dashed line stands for the direction of the MRI velocity field, θV = 44.5°.
Current usage metrics show cumulative count of Article Views (full-text article views including HTML views, PDF and ePub downloads, according to the available data) and Abstracts Views on Vision4Press platform.
Data correspond to usage on the plateform after 2015. The current usage metrics is available 48-96 hours after online publication and is updated daily on week days.
Initial download of the metrics may take a while.