Fig. 3.
Download original image
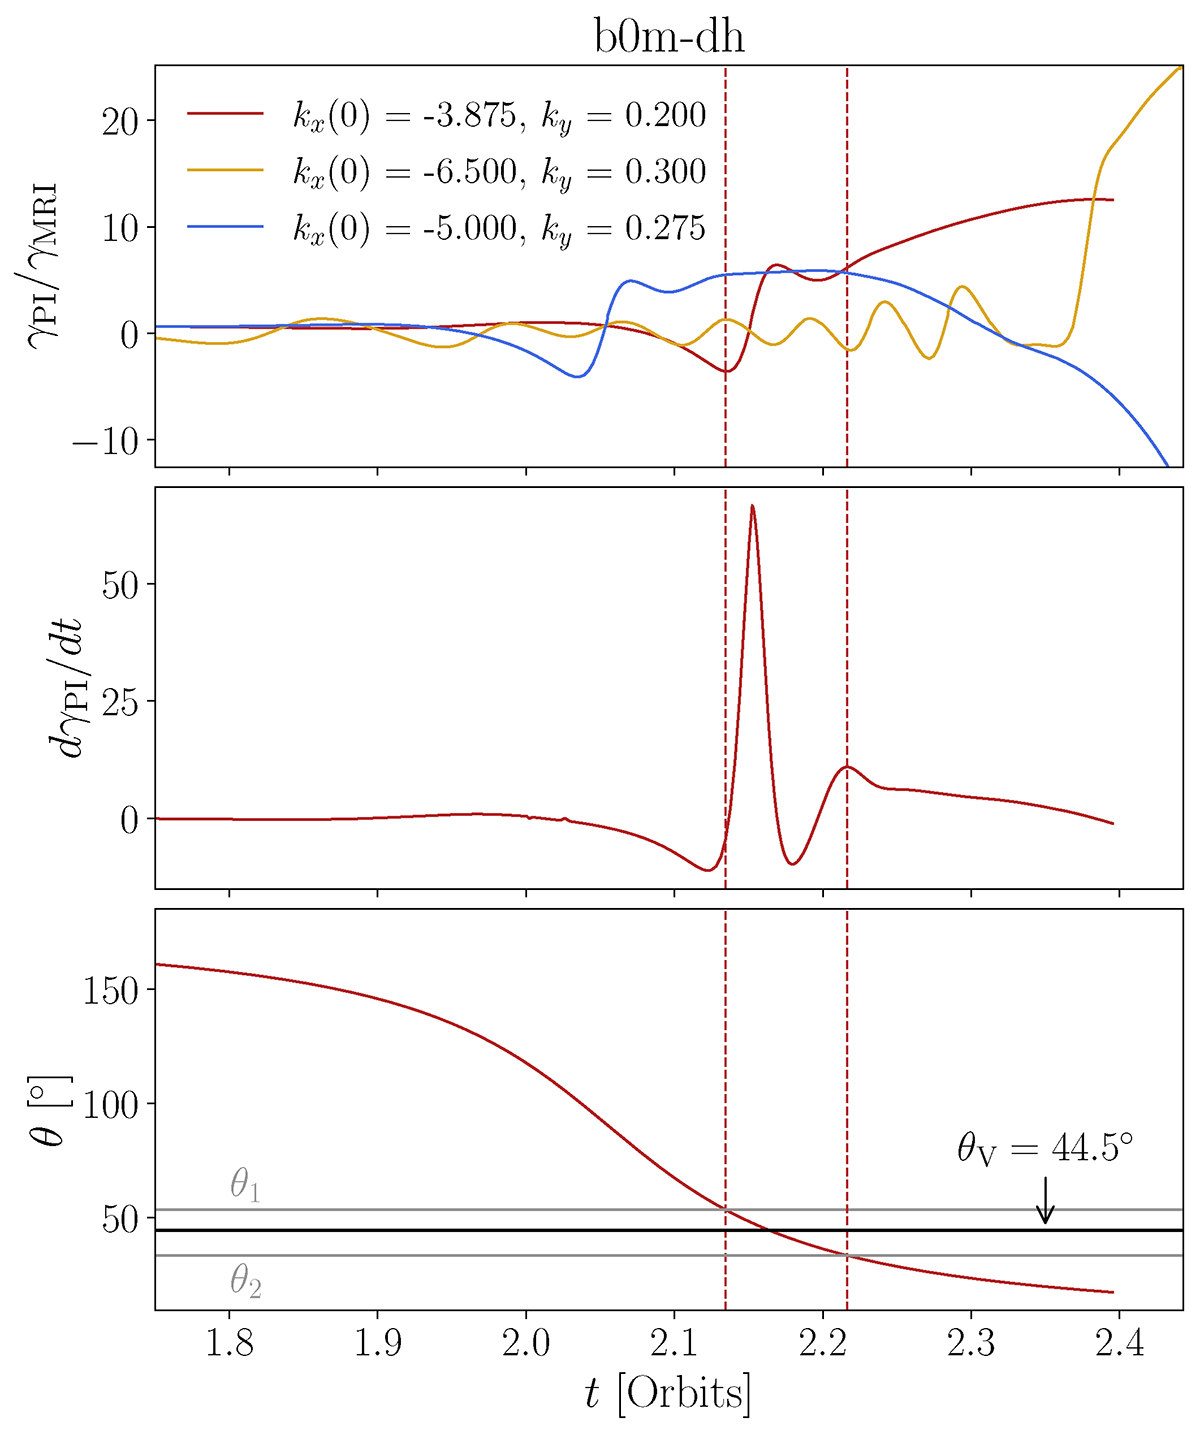
Top panel: time evolution of the normalized growth rate for the same modes as in Fig. 2. The growth rate stays considerably low up to a certain point, where it starts increasing to become more than ten times larger than the growth rate of the MRI (for the cases that reach saturation). Middle panel: evolution of the time derivative of γPI for the fastest mode. We draw vertical lines where the derivative takes positive values and at its last local maximum before saturation. Between these times, the parasitic mode grows the fastest. In the bottom panel, we show the evolution of the wavevector angle θ. We depict horizontal gray lines showing θ1 and θ2, i.e., the values of θ that indicate the fastest growth of the parasitic mode.
Current usage metrics show cumulative count of Article Views (full-text article views including HTML views, PDF and ePub downloads, according to the available data) and Abstracts Views on Vision4Press platform.
Data correspond to usage on the plateform after 2015. The current usage metrics is available 48-96 hours after online publication and is updated daily on week days.
Initial download of the metrics may take a while.