Fig. 2.
Download original image
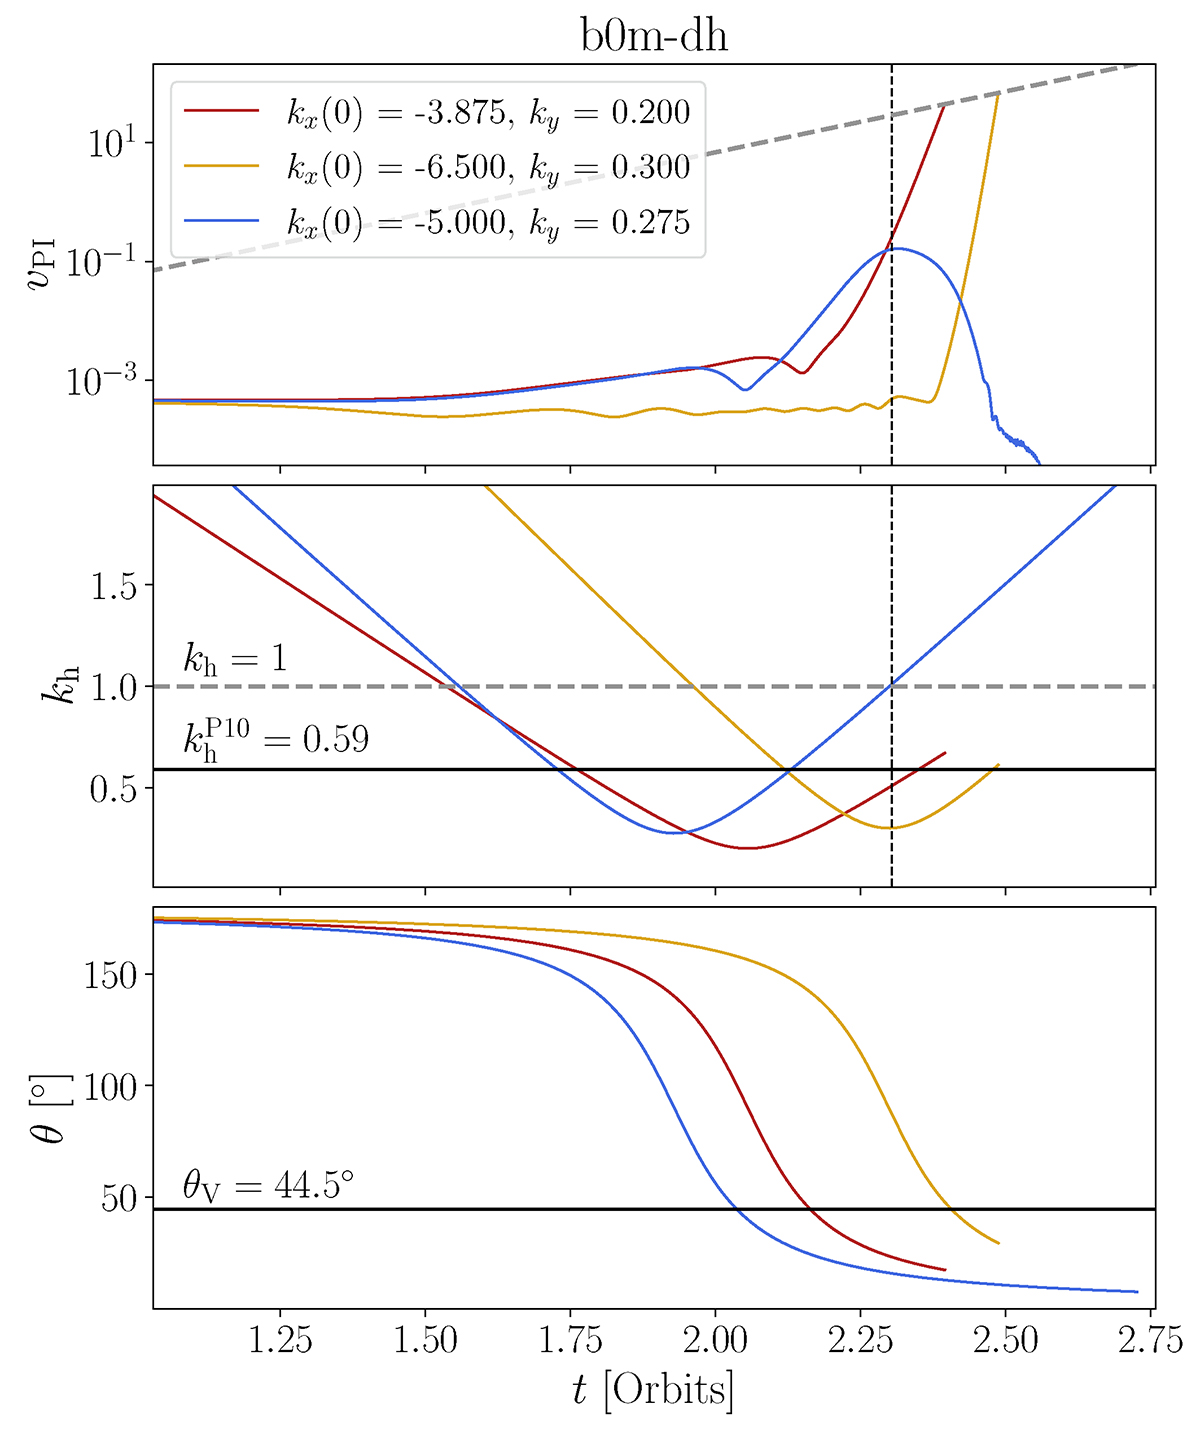
Top panel: time evolution of the averaged velocity, vPI, of three parasitic modes from the run b0m-dh: the fastest (red), another that saturates at later times (yellow), and one mode that does not saturate (blue). Middle panel: time evolution of the parasitic wavevector kh. Bottom panel: time evolution of the angle θ between the wavevector kh and the radial direction, ![]() . The modes start growing faster when kh and θ approach the values found in Pessah (2010), denoted as
. The modes start growing faster when kh and θ approach the values found in Pessah (2010), denoted as ![]() and θP10, respectively.
and θP10, respectively.
Current usage metrics show cumulative count of Article Views (full-text article views including HTML views, PDF and ePub downloads, according to the available data) and Abstracts Views on Vision4Press platform.
Data correspond to usage on the plateform after 2015. The current usage metrics is available 48-96 hours after online publication and is updated daily on week days.
Initial download of the metrics may take a while.