Fig. 4
Download original image
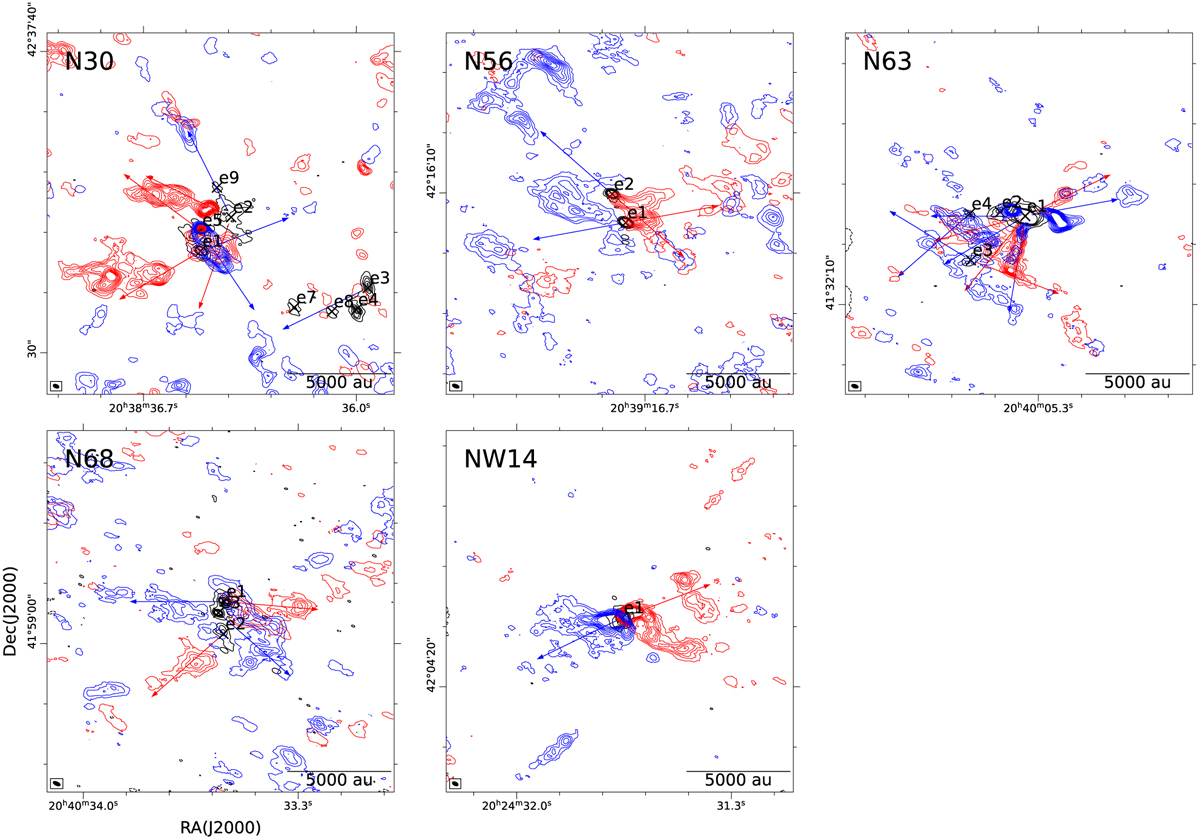
Integrated CO 2–1 emission in each source. The black contours show the NOEMA 1.3 mm continuum emission, the same as in Fig. 2. The red and blue contours show the redshifted and blueshifted CO emission in outflows, respectively. The contour levels start from 3σ and increase in steps of 3σ, where σ is the rms of the integrated CO emission. The red and blue arrows mark the identified outflow axes.
Current usage metrics show cumulative count of Article Views (full-text article views including HTML views, PDF and ePub downloads, according to the available data) and Abstracts Views on Vision4Press platform.
Data correspond to usage on the plateform after 2015. The current usage metrics is available 48-96 hours after online publication and is updated daily on week days.
Initial download of the metrics may take a while.