Fig. 6
Download original image
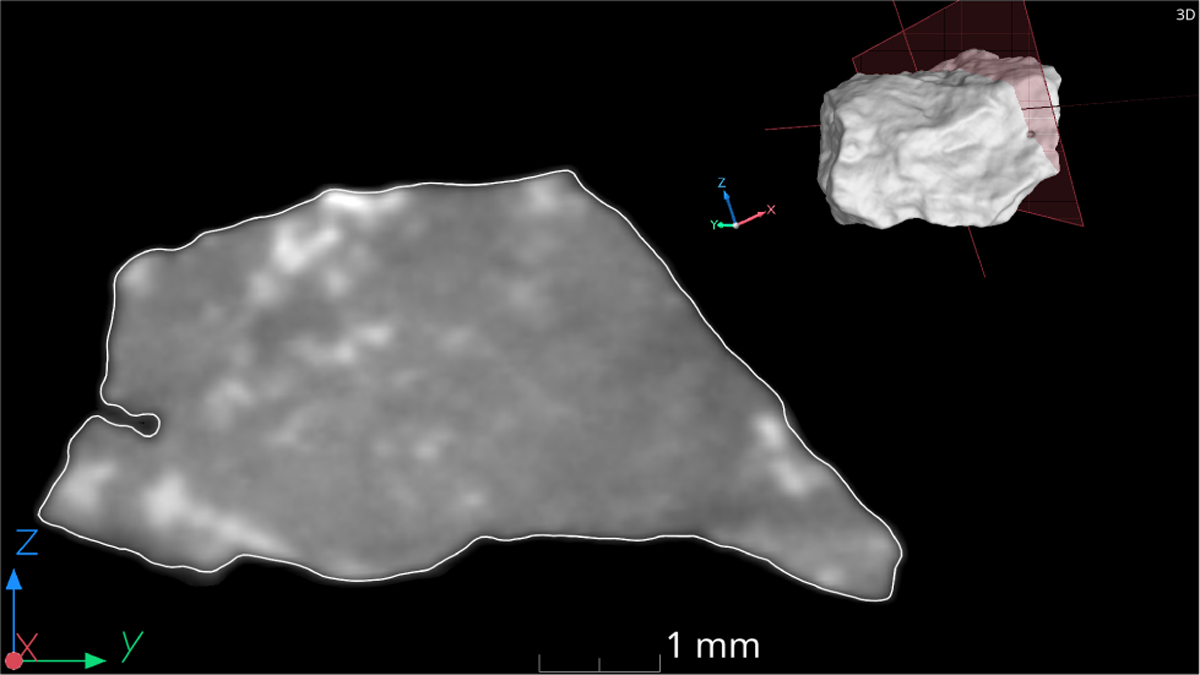
Example of a hole in the interior of a shape model L02A105a, corresponding to real hole in the fragment filled by secondary minerals replacing weathered iron grain. The tomogram shows the attenuation (represented by degrees of gray) in the cross section of the corresponding fragment. The white line is the outline of the reconstructed surface. The position of the tomogram is shown in the right corner on the 3D render as the red plane.
Current usage metrics show cumulative count of Article Views (full-text article views including HTML views, PDF and ePub downloads, according to the available data) and Abstracts Views on Vision4Press platform.
Data correspond to usage on the plateform after 2015. The current usage metrics is available 48-96 hours after online publication and is updated daily on week days.
Initial download of the metrics may take a while.