Fig. 4
Download original image
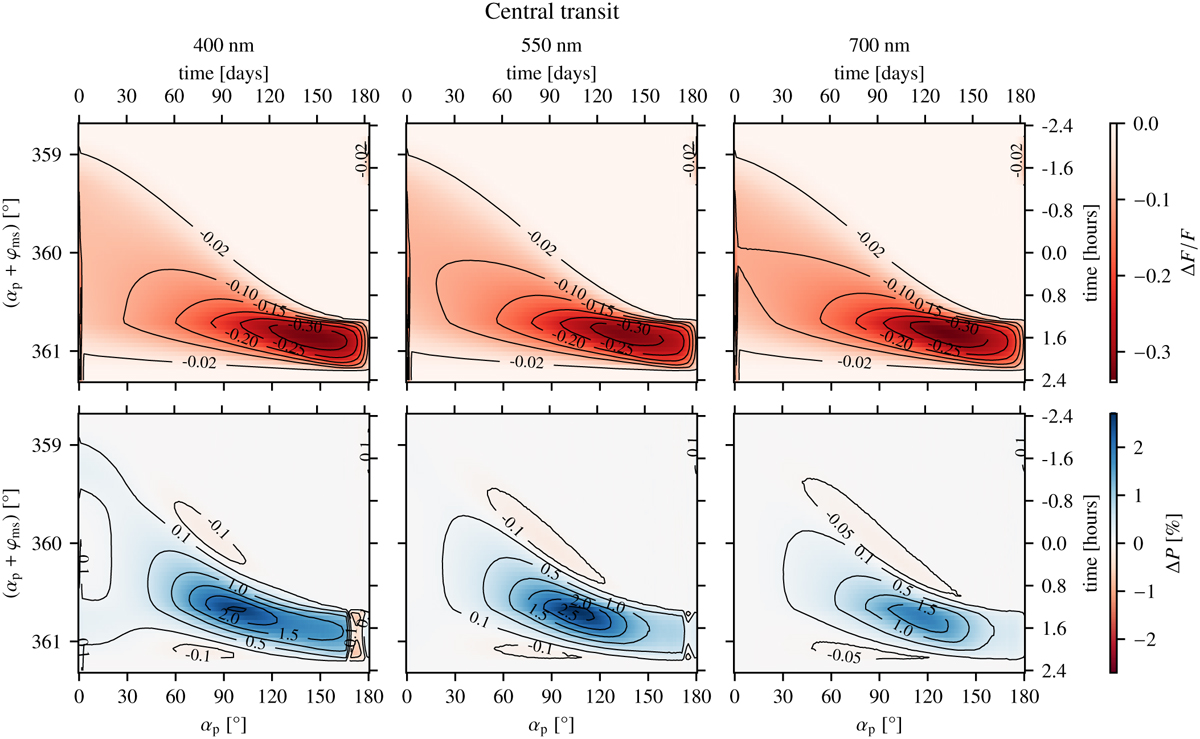
Relative change of the total flux △F/F (top row) and absolute change of the degree of polarization △P (bottom row) during central transits of the moon in front of the planet at different phase angles αp visualized using color maps and contour lines. The upper abscissa shows the time in days since the planet was at α = 0°. On the left ordinate, the relevant angle αp + φms is shown. The angle was transformed to a time in hours on the right ordinate, where a time of 0 corresponds to the time when the planet, moon, and observer are perfectly aligned. A single transit of the moon corresponds to a passage through the color maps perpendicular to the abscissa. For phase angles above 180°, F(360° − αp, 360° − φms) = F(αp, φms).
Current usage metrics show cumulative count of Article Views (full-text article views including HTML views, PDF and ePub downloads, according to the available data) and Abstracts Views on Vision4Press platform.
Data correspond to usage on the plateform after 2015. The current usage metrics is available 48-96 hours after online publication and is updated daily on week days.
Initial download of the metrics may take a while.