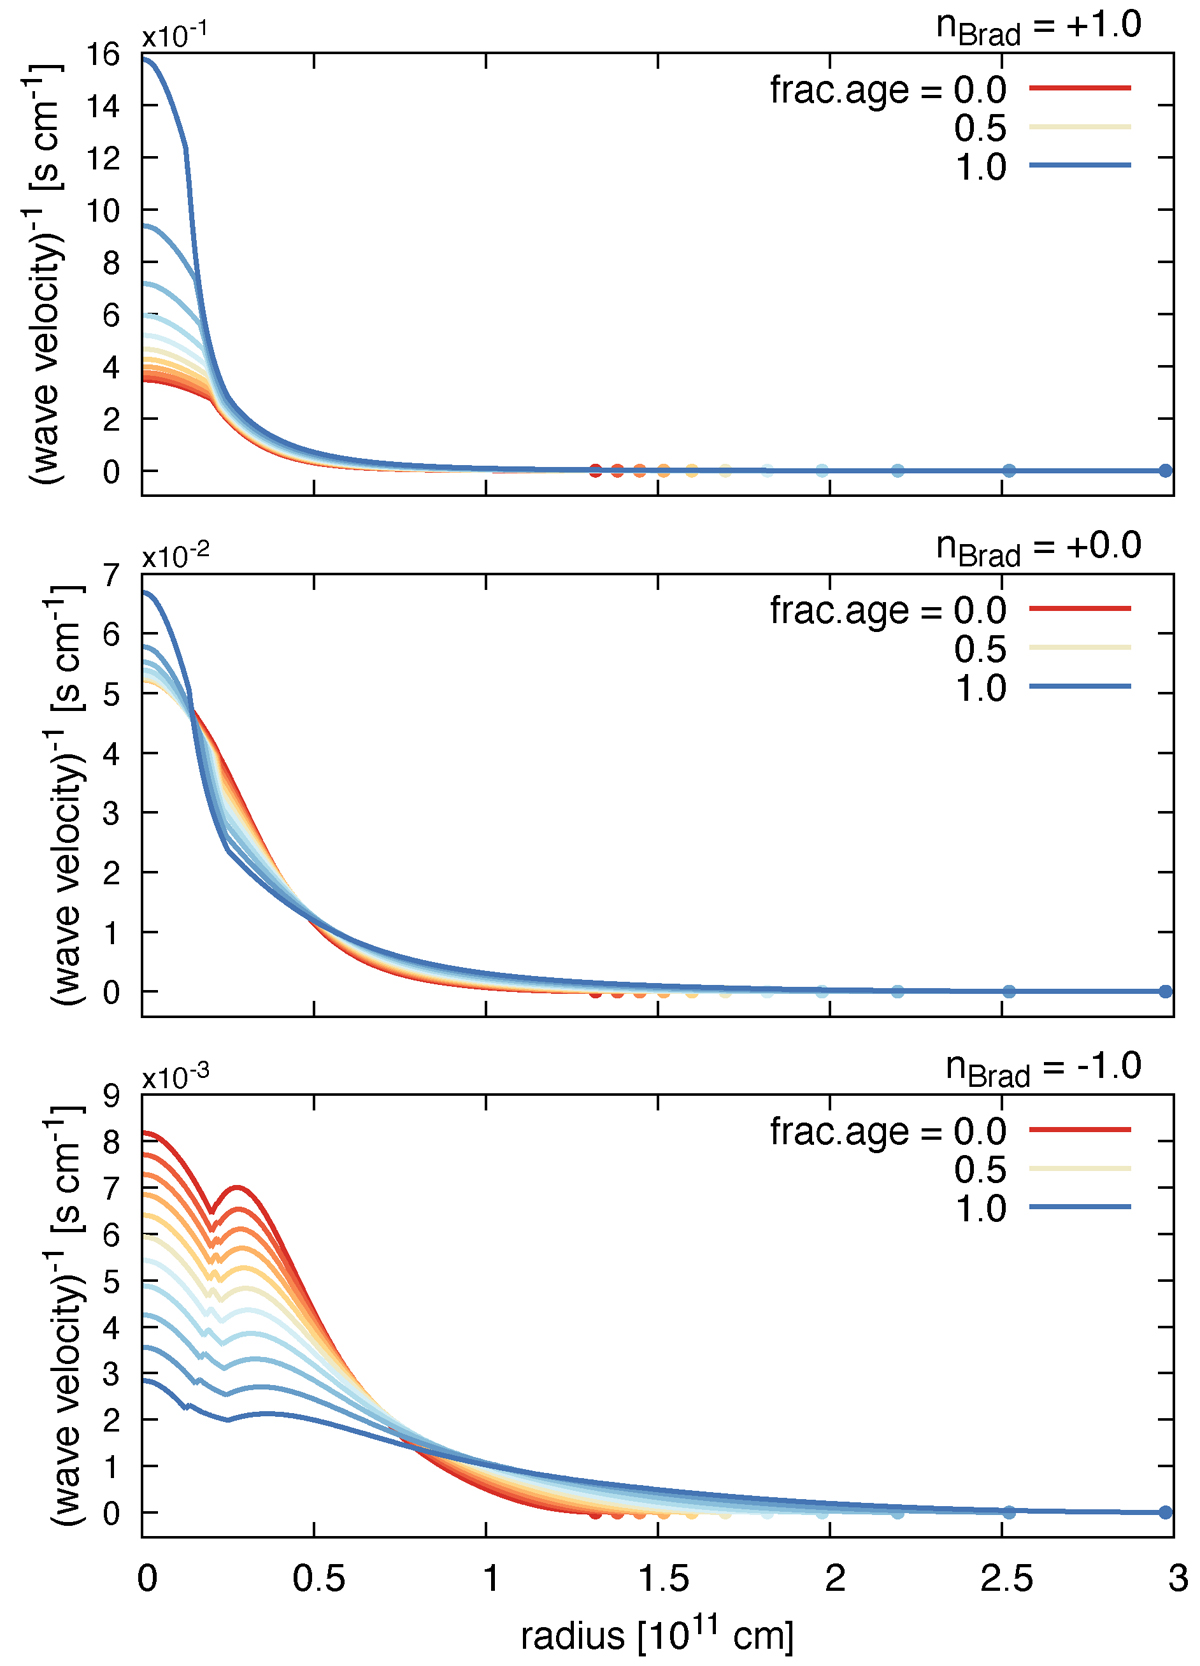
Fig. 6.
Download original image
Inverse of the velocity of the torsional Alfvén wave as a function of radius. The enclosed area by the curves corresponds to the crossing time. From top to bottom, results for nBrad = +1.0, +0.0, and −1.0, with Bpole = 1 kG are shown. The density distributions are based on the 3 M⊙ model. Each panel includes 11 lines corresponding to different fractional main-sequence ages of 0.0, 0.1, …, 1.0, with the color of the lines changing from red to blue. Filled circles represent a change in radius.
Current usage metrics show cumulative count of Article Views (full-text article views including HTML views, PDF and ePub downloads, according to the available data) and Abstracts Views on Vision4Press platform.
Data correspond to usage on the plateform after 2015. The current usage metrics is available 48-96 hours after online publication and is updated daily on week days.
Initial download of the metrics may take a while.