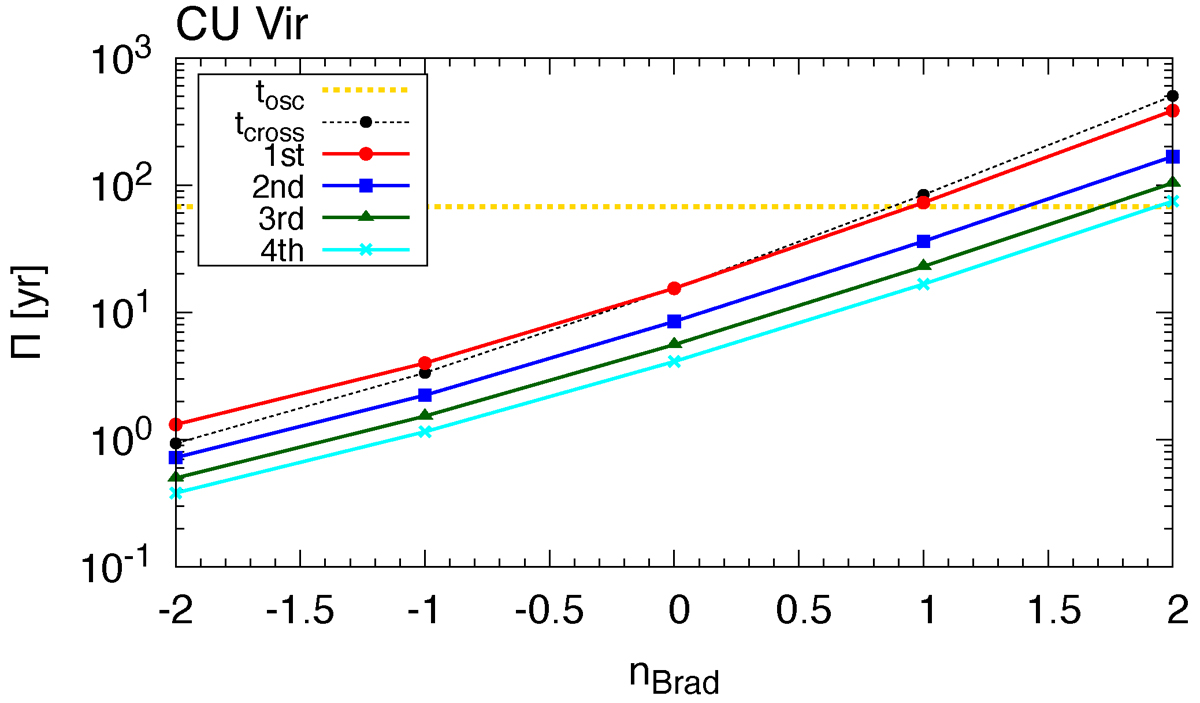
Fig. 4.
Download original image
Dependence of oscillation periods on nBrad estimated for the CU Vir model for eigenfunctions from the first to the fourth orders. Different line styles are used for first (red, circle), second (blue, square), third (green, triangle), and fourth (cyan, cross). For comparison, tcross is indicated by a dotted black line. The constant value (dashed yellow line) corresponds to the oscillation period suggested for CU Vir (67.6 yr).
Current usage metrics show cumulative count of Article Views (full-text article views including HTML views, PDF and ePub downloads, according to the available data) and Abstracts Views on Vision4Press platform.
Data correspond to usage on the plateform after 2015. The current usage metrics is available 48-96 hours after online publication and is updated daily on week days.
Initial download of the metrics may take a while.