Fig. 3.
Download original image
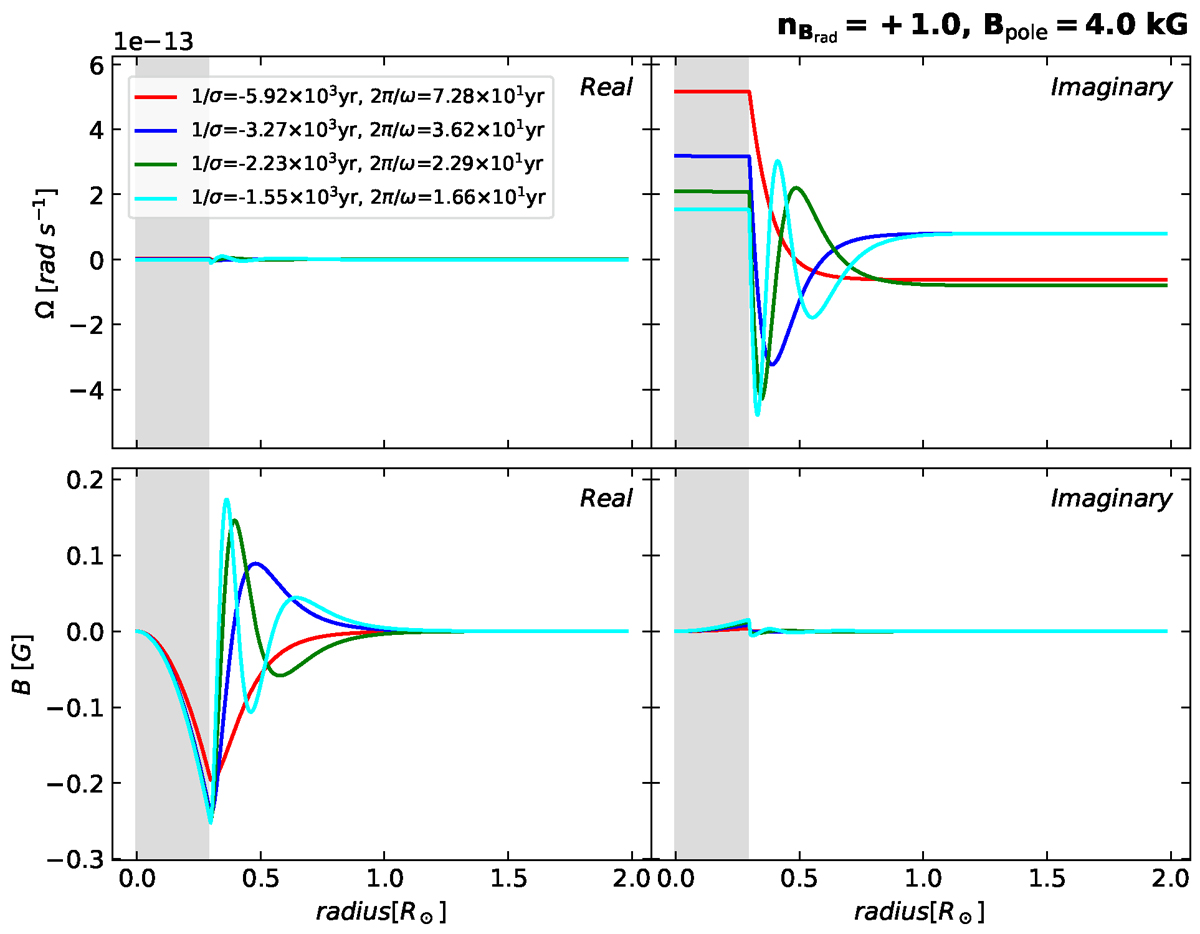
Eigenfunctions obtained for the CU Vir model with nBrad = +1.0. Top panels: Distribution of angular velocity, Ω(r). Bottom panels: Toroidal magnetic field component, B(r). In each row, the left panel shows the real part, and the right panel the imaginary part. The modes from the lowest to the fourth are indicated as red, blue, green, and cyan lines. The reciprocals of the eigenvalues for each mode are shown in the legend. The gray-shaded area indicates the central convective region.
Current usage metrics show cumulative count of Article Views (full-text article views including HTML views, PDF and ePub downloads, according to the available data) and Abstracts Views on Vision4Press platform.
Data correspond to usage on the plateform after 2015. The current usage metrics is available 48-96 hours after online publication and is updated daily on week days.
Initial download of the metrics may take a while.