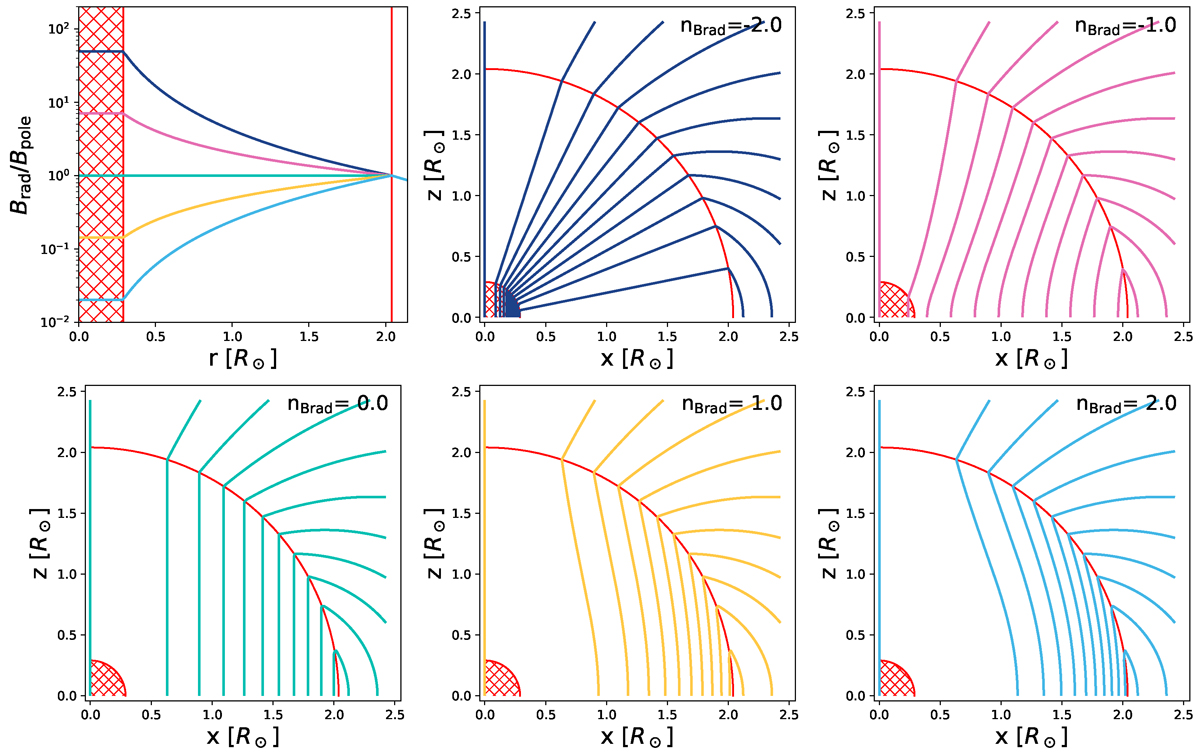
Fig. 2.
Download original image
Examples of the parametric poloidal field structures applied in this work. Solid lines in the top-left panel show the radial dependences of Brad/Bpole(r) functions with nBrad = −2.0 (dark blue), −1.0 (magenta), +0.0 (green), +1.0 (yellow), and +2.0 (cyan). The red-hatched region in the stellar center corresponds to the central convective region, in which the magnetic field is assumed to be constant. The vertical solid red line indicates the stellar surface, where Brad/Bpole(r) = 1. The remaining plots show the two-dimensional poloidal field structures in the meridional cuts. As in the top-left panel, the red-hatched area shows the central convective region and the solid red curve is the stellar surface.
Current usage metrics show cumulative count of Article Views (full-text article views including HTML views, PDF and ePub downloads, according to the available data) and Abstracts Views on Vision4Press platform.
Data correspond to usage on the plateform after 2015. The current usage metrics is available 48-96 hours after online publication and is updated daily on week days.
Initial download of the metrics may take a while.