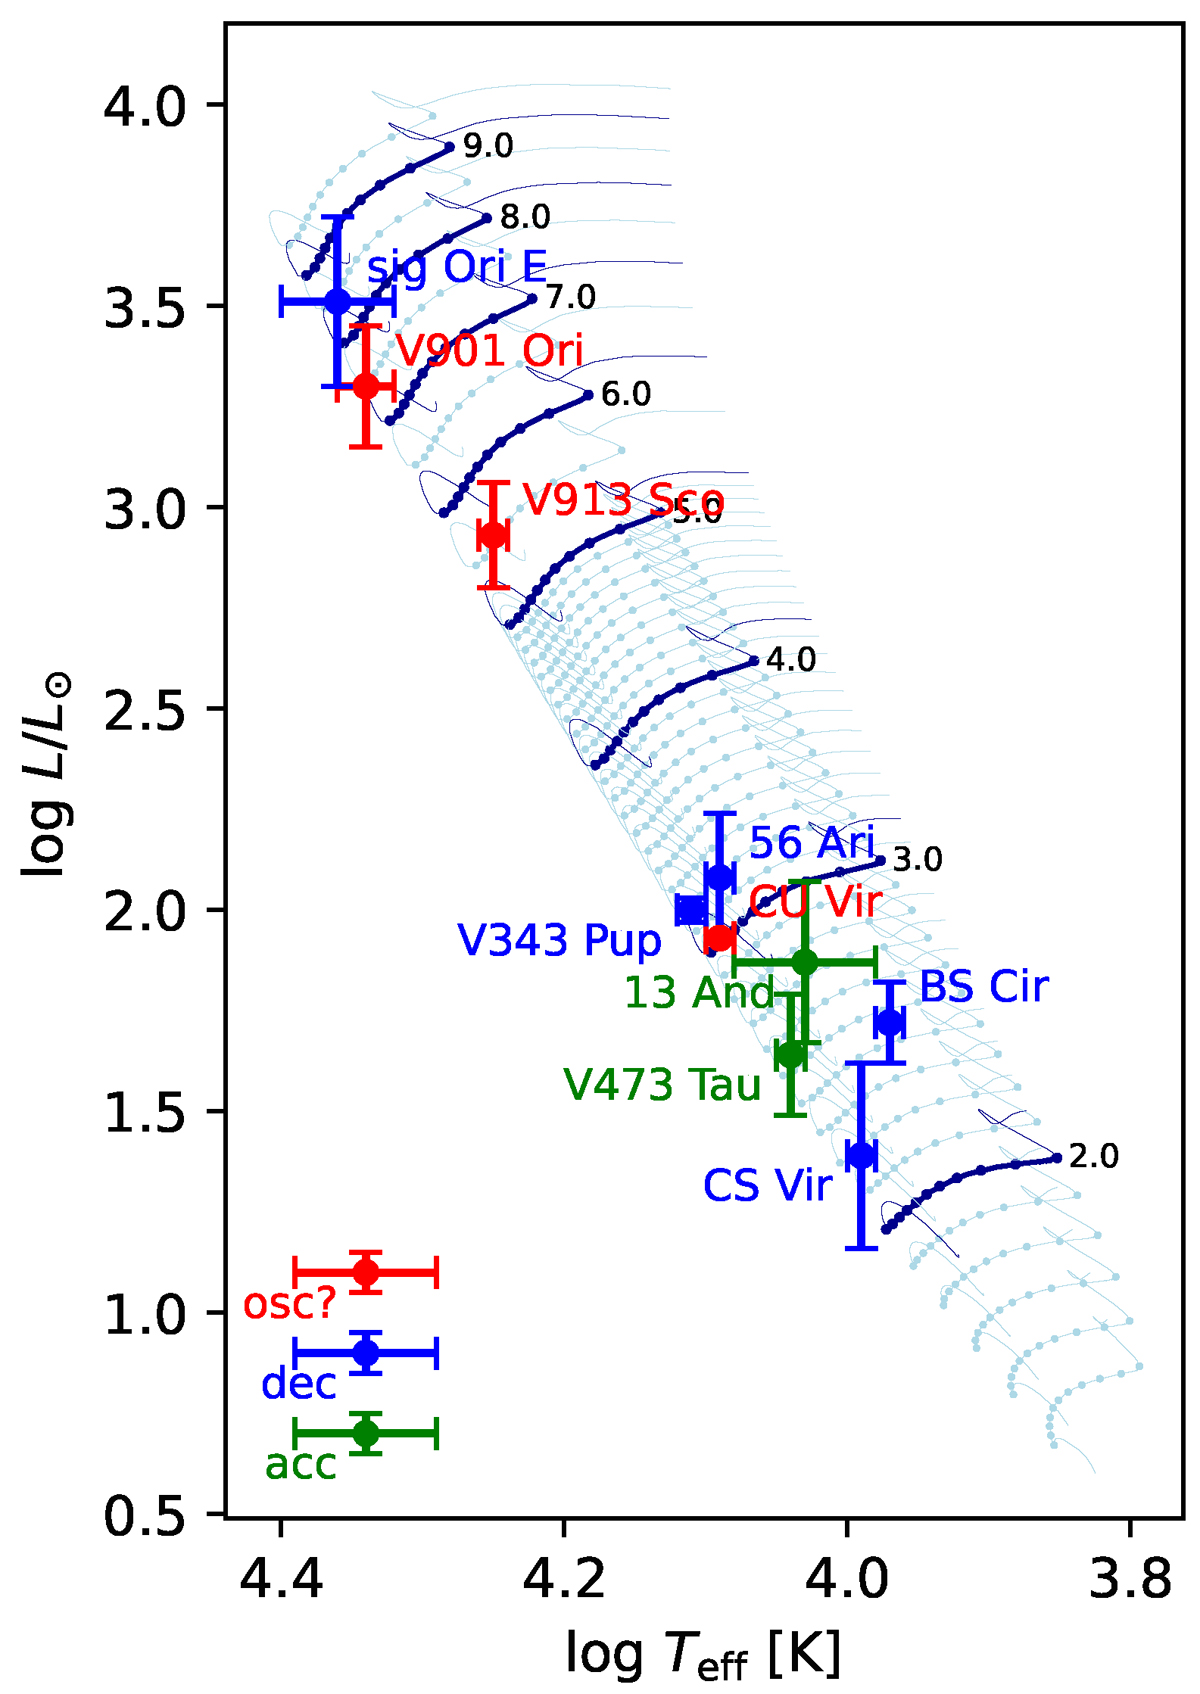
Fig. 1.
Download original image
Ten magnetic stars where rotational period variations have been detected shown on the HR diagram. Those showing a long-term increase in rotation period are represented in blue (decelerating), those with a decrease in green (accelerating), and those transitioning from an increase to a decrease (or vice versa) in red (oscillating). The solid curves represent the results of evolution calculations of nonrotating, nonmagnetic stars. Models with ZAMS masses from 1.5 to 5 M⊙ are shown at intervals of 0.1 M⊙, while models with ZAMS masses from 5.5 to 9.5 M⊙ are shown at intervals of 0.5 M⊙. The numbers displayed next to the solid curves represent the ZAMS mass. To indicate the ages, points were placed at ten equal divisions of the period from ZAMS to TAMS.
Current usage metrics show cumulative count of Article Views (full-text article views including HTML views, PDF and ePub downloads, according to the available data) and Abstracts Views on Vision4Press platform.
Data correspond to usage on the plateform after 2015. The current usage metrics is available 48-96 hours after online publication and is updated daily on week days.
Initial download of the metrics may take a while.