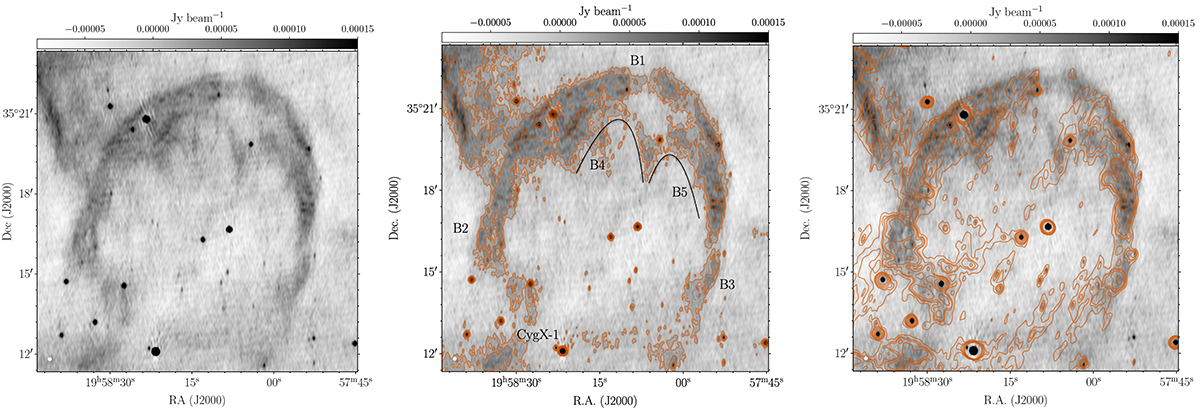
Fig. 4.
Download original image
Zoomed-in image of the Cyg X-1 bow shock as observed by MeerKAT in the S band. Left panel: Image of Cyg X-1 and the bow shock. Middle panel: Contours of the S-band emission overlaid on the image, with B1, B2, and B3 marked to show the emission regions used to estimate various bow shock parameters. B4 and B5 mark the location of the smaller arcs within the larger bow shock structure. We also trace these structures with black arcs to draw the reader’s eye to the structure. Right panel: L-band bow shock contours overlaid on the S-band image of the bow shock to compare the morphology of the bow shock in the two frequency bands.
Current usage metrics show cumulative count of Article Views (full-text article views including HTML views, PDF and ePub downloads, according to the available data) and Abstracts Views on Vision4Press platform.
Data correspond to usage on the plateform after 2015. The current usage metrics is available 48-96 hours after online publication and is updated daily on week days.
Initial download of the metrics may take a while.