Open Access
Fig. 1.
Download original image
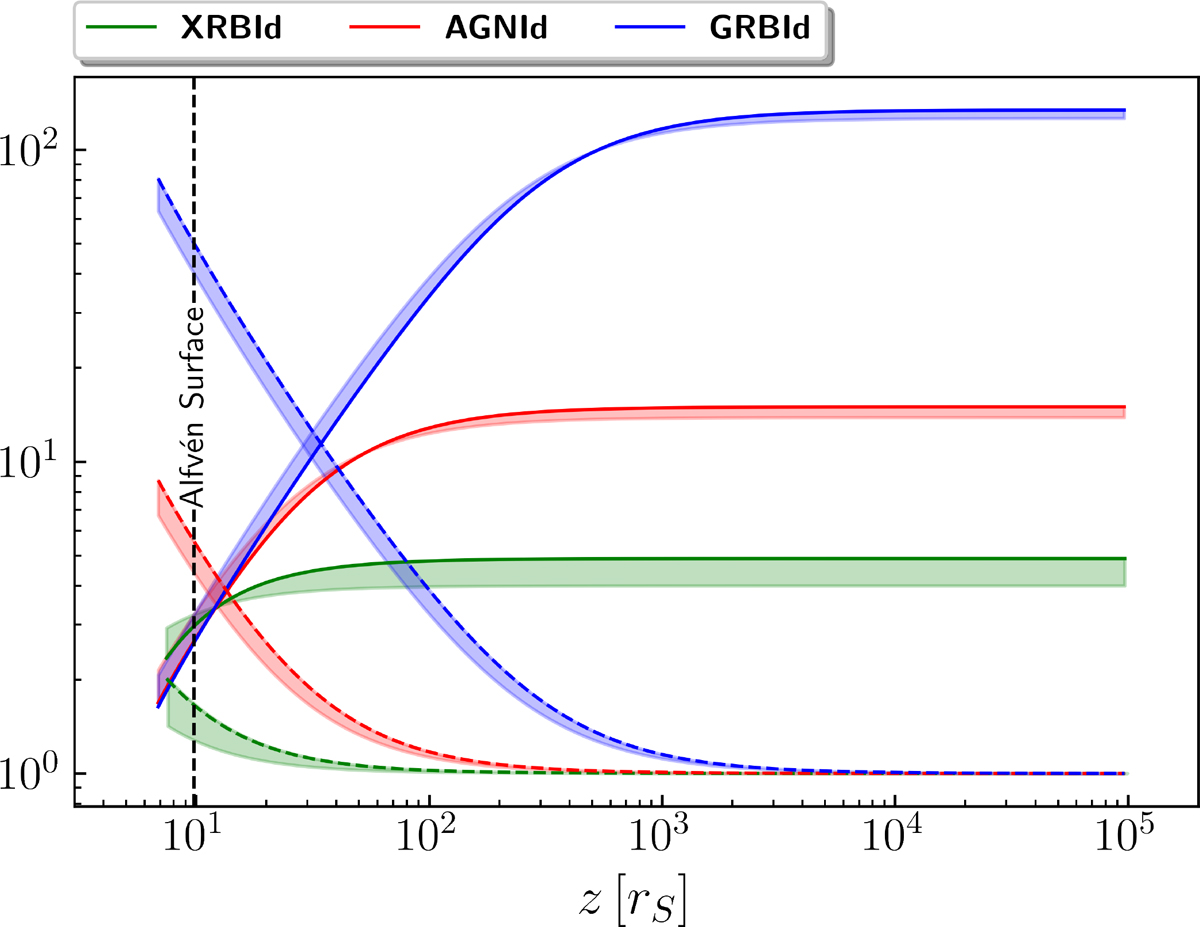
−Ut, (solid lines) and specific enthalpy, ξ, (dashed lines) for the XRBId, AGNId, and GRBId solutions. The solid and dashed lines correspond to the values of −Ut and ξ along each jet’s boundary streamline. The shaded regions show the variation of each quantity as we move from the boundary streamline to the jet axis.
Current usage metrics show cumulative count of Article Views (full-text article views including HTML views, PDF and ePub downloads, according to the available data) and Abstracts Views on Vision4Press platform.
Data correspond to usage on the plateform after 2015. The current usage metrics is available 48-96 hours after online publication and is updated daily on week days.
Initial download of the metrics may take a while.