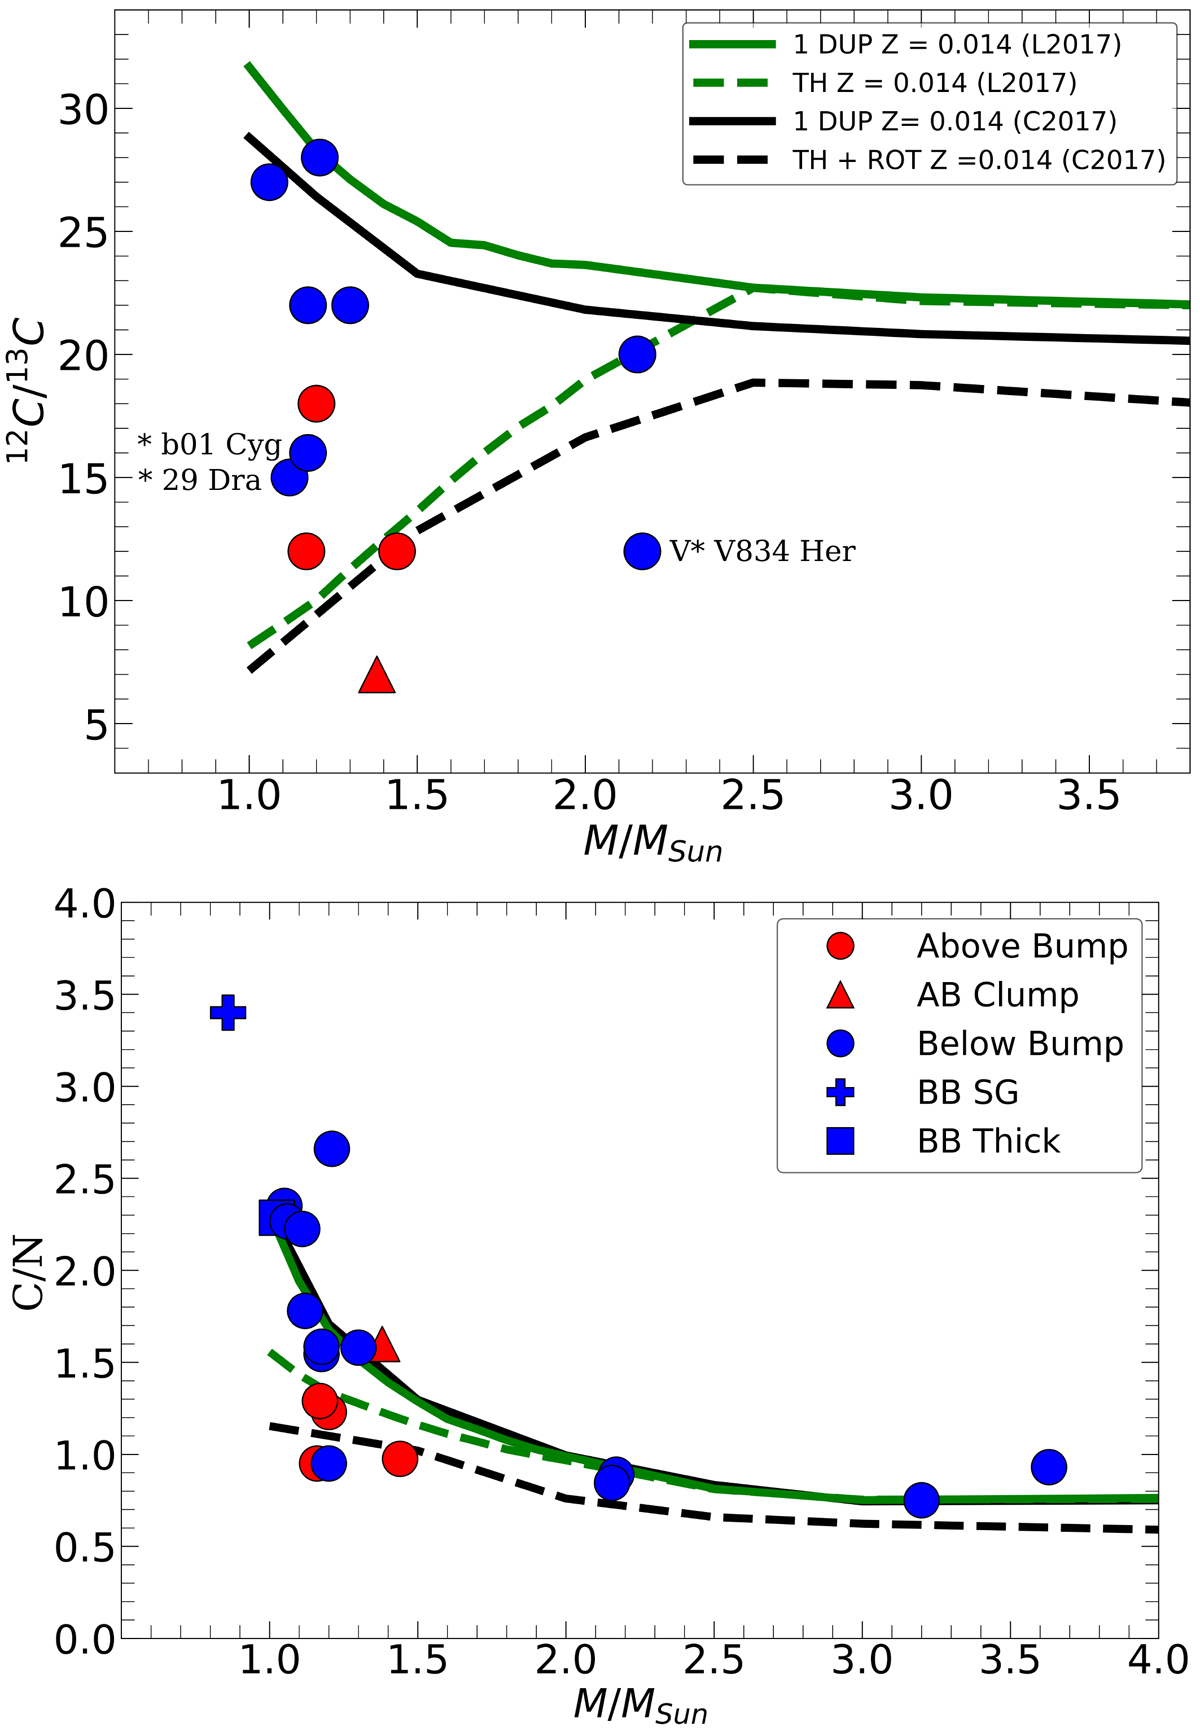
Fig. 5.
Download original image
Ratios of 12C/13C and C/N of the investigated stars compared with theoretical models. The solid green line represents the 12C/13C and C/N ratios predicted by the model for stars at the first dredge-up (1 DUP) and the dashed green line represents the minimal values in the model with thermohaline-induced extra mixing (TH), both taken from Lagarde et al. (2017). The solid black line represents the 12C/13C and C/N ratios predicted by the model for stars at the first dredge-up (1 DUP) and the dashed black line represents the minimal values in the model with thermohaline- and rotation-induced extra mixing (TH+ROT), both taken from Charbonnel et al. (2017). Symbols are the same as in Fig. 3.
Current usage metrics show cumulative count of Article Views (full-text article views including HTML views, PDF and ePub downloads, according to the available data) and Abstracts Views on Vision4Press platform.
Data correspond to usage on the plateform after 2015. The current usage metrics is available 48-96 hours after online publication and is updated daily on week days.
Initial download of the metrics may take a while.