Fig. 3.
Download original image
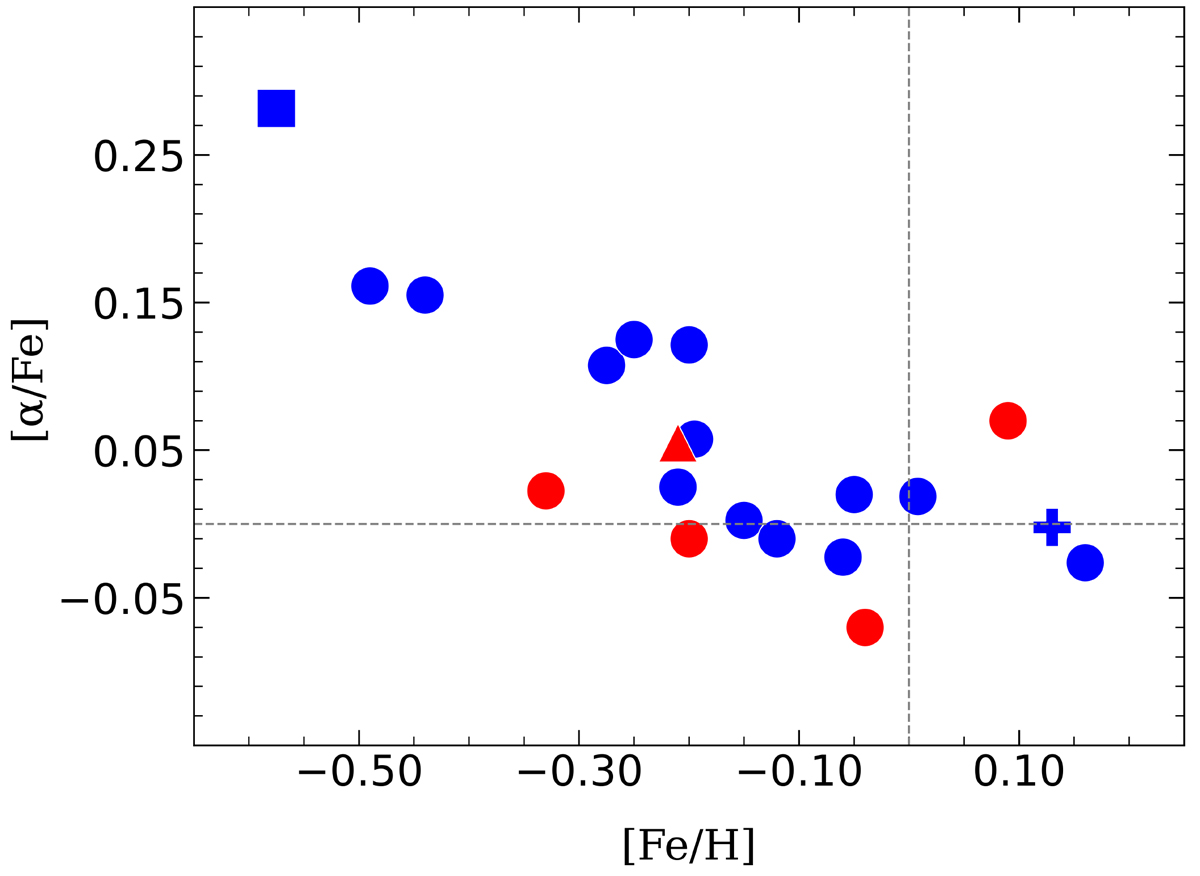
Observed α-to-iron element abundance ratios as a function of [Fe/H]. The value of [α/Fe I] is computed as an average of the following elements: Mg I, Si I, Ca I, and Ti I. The meaning of symbols: the square is for the thick disc star, the circles are for the red giant branch stars, the plus sign marks a subgiant star, and the triangle is for the red clump star. The blue symbols mean that a star is at the evolutionary stage below the red giant luminosity bump, and the red is for stars at the evolutionary stage above the RGB luminosity bump.
Current usage metrics show cumulative count of Article Views (full-text article views including HTML views, PDF and ePub downloads, according to the available data) and Abstracts Views on Vision4Press platform.
Data correspond to usage on the plateform after 2015. The current usage metrics is available 48-96 hours after online publication and is updated daily on week days.
Initial download of the metrics may take a while.