Open Access
Fig. 9.
Download original image
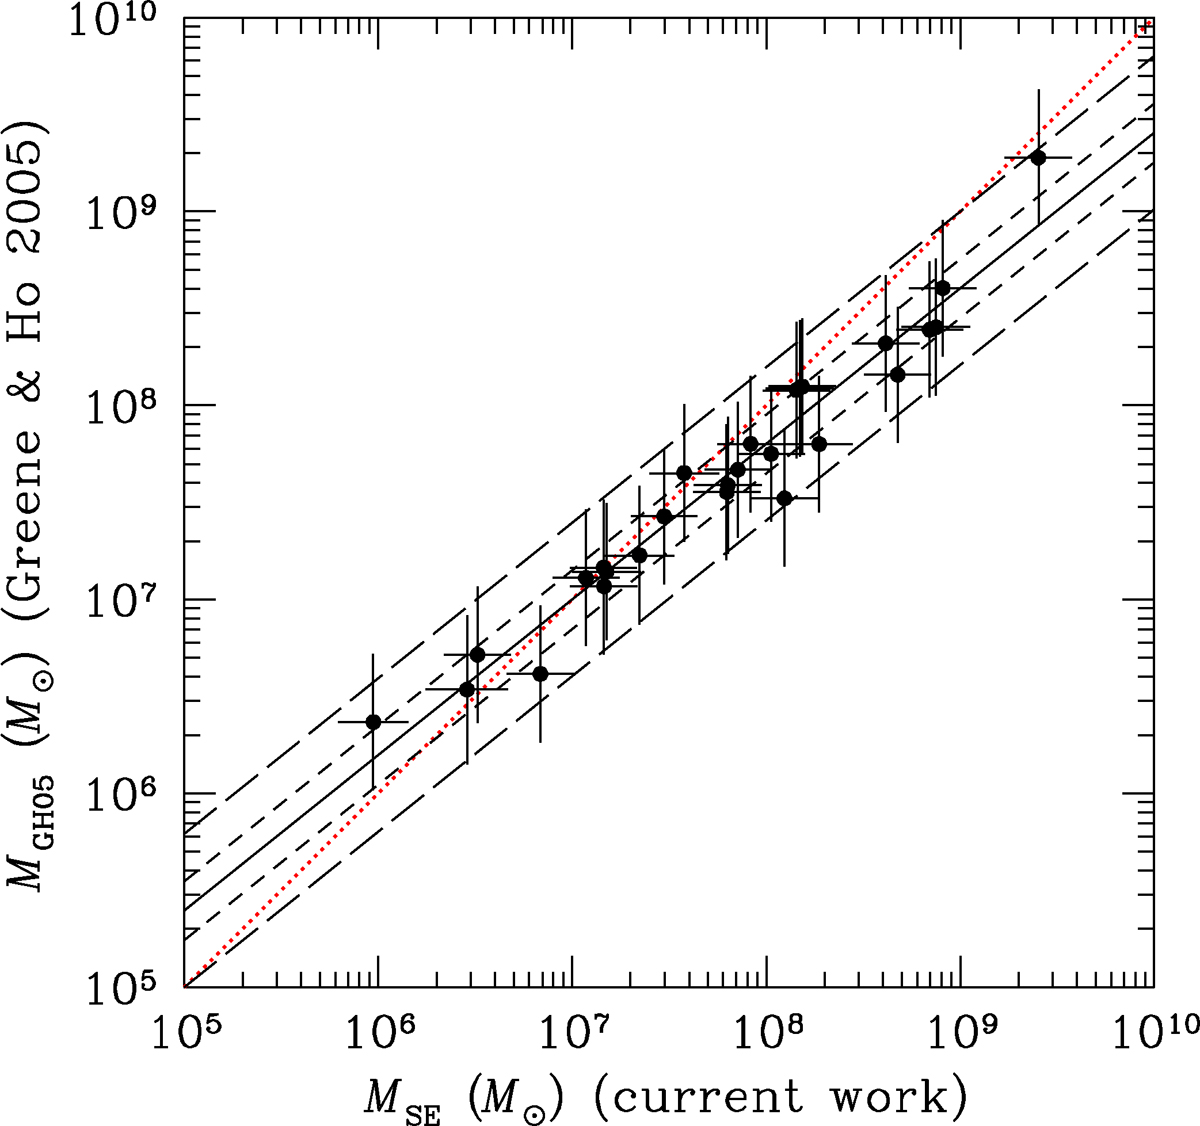
Direct comparison of the mass predictions from Greene & Ho (2005) and from the current work. The dotted red line is the locus where the predictions are equal. The short-dash black lines show this ±1σ envelope and the long-dash lines show the ±2.6σ envelope. Note that mass rather than the virial product is plotted.
Current usage metrics show cumulative count of Article Views (full-text article views including HTML views, PDF and ePub downloads, according to the available data) and Abstracts Views on Vision4Press platform.
Data correspond to usage on the plateform after 2015. The current usage metrics is available 48-96 hours after online publication and is updated daily on week days.
Initial download of the metrics may take a while.