Fig. 6.
Download original image
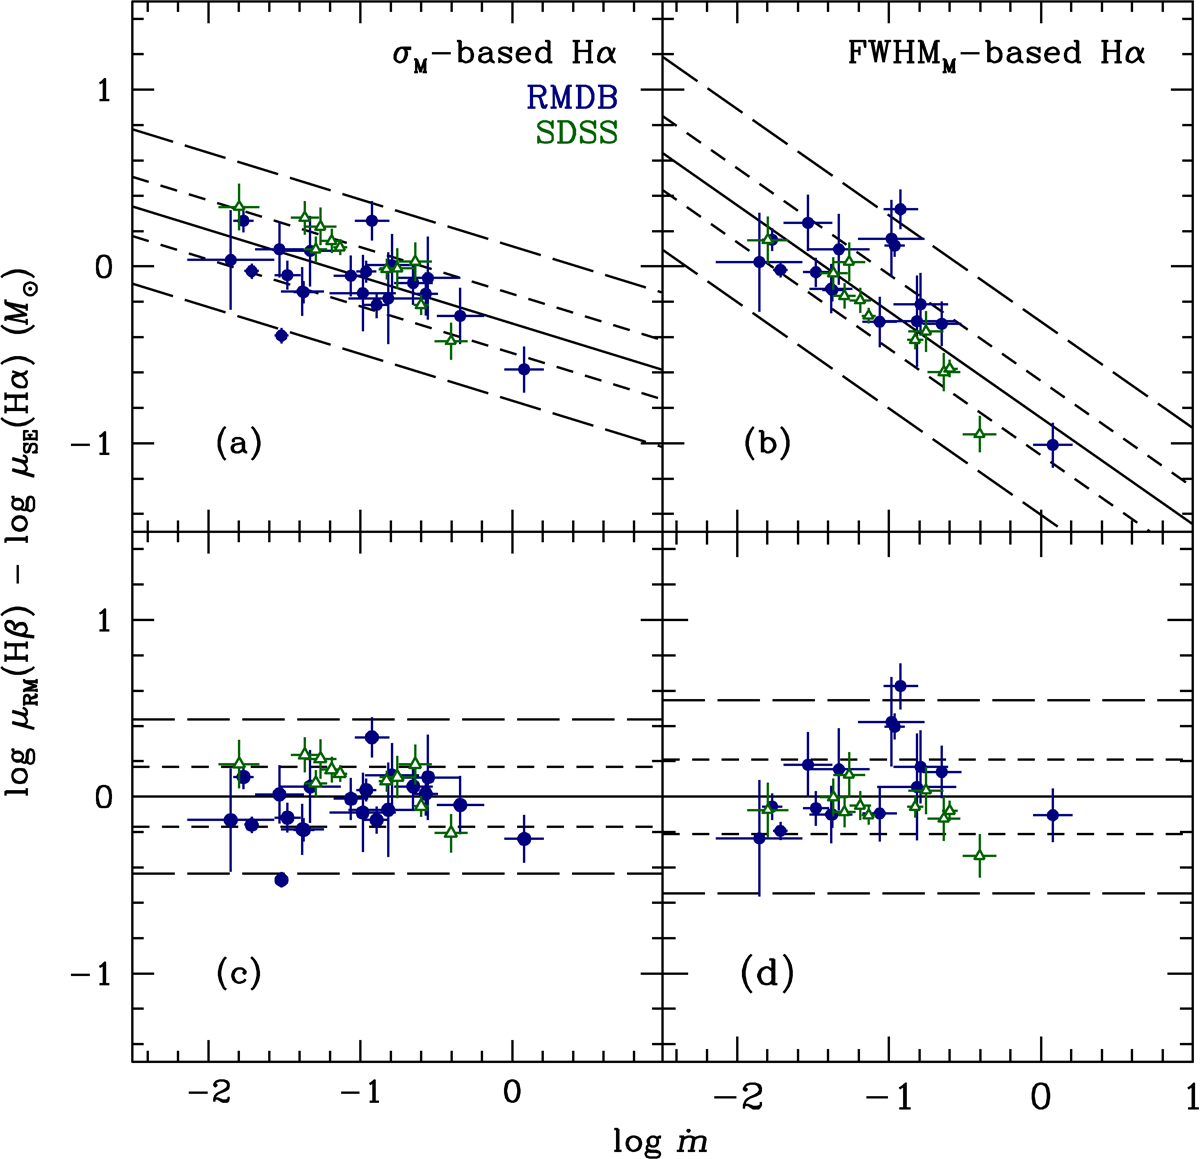
Mass residuals as a function of Eddington rate. (a) Mass residuals (Eq. (16)), i.e. the difference between the measured reverberation virial products and those predicted by Eq. (12). The residuals are plotted vs the Eddington ratio. The solid line represents the best fit, the short-dashed lines the ±1σ envelope, and the long-dashed line the ±2.6σ envelope. Blue circles are from Table A.1, and green triangles are from Table B.1. (b) Mass residuals, i.e. the difference between the measured reverberation virial products and those predicted by Eq. (15). Panels (c) and (d) show residuals after subtraction of the best-fit relations shown in panels (a) and (b).
Current usage metrics show cumulative count of Article Views (full-text article views including HTML views, PDF and ePub downloads, according to the available data) and Abstracts Views on Vision4Press platform.
Data correspond to usage on the plateform after 2015. The current usage metrics is available 48-96 hours after online publication and is updated daily on week days.
Initial download of the metrics may take a while.