Fig. 5.
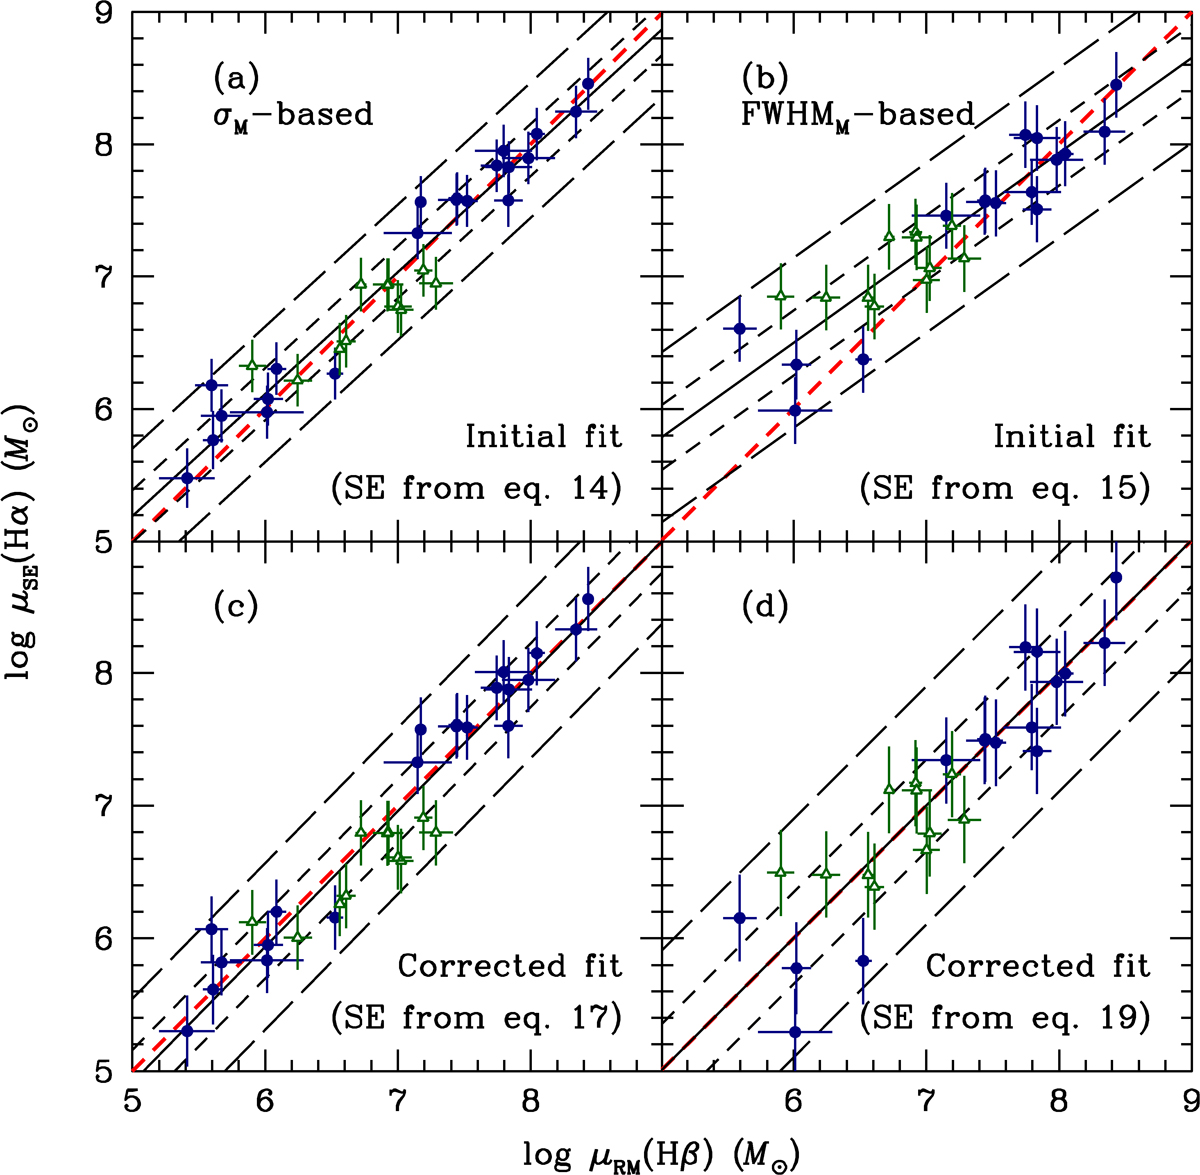
Download original image
Comparison between SE mass estimates and reverberation measurements. Upper: SE Hα-based virial product predictions using Eqs. (14) and (15) in panels (a) and (b), respectively. The coefficients for the best fit appear in the first two lines of Table 1. Blue circles are data from Table A.1, and green triangles are from Table B.1. The solid line is the best fit to the data, and the dotted red line shows where the measures are equal. The short- and long-dashed lines show the ±1σ and ±2.6σ envelopes, respectively. Lower: Corrected SE masses from Hα-based virial product predictions using Eq. (17) (panel c) and Eq. (19) (panel d), in both cases with log f = 0 arbitrarily.
Current usage metrics show cumulative count of Article Views (full-text article views including HTML views, PDF and ePub downloads, according to the available data) and Abstracts Views on Vision4Press platform.
Data correspond to usage on the plateform after 2015. The current usage metrics is available 48-96 hours after online publication and is updated daily on week days.
Initial download of the metrics may take a while.