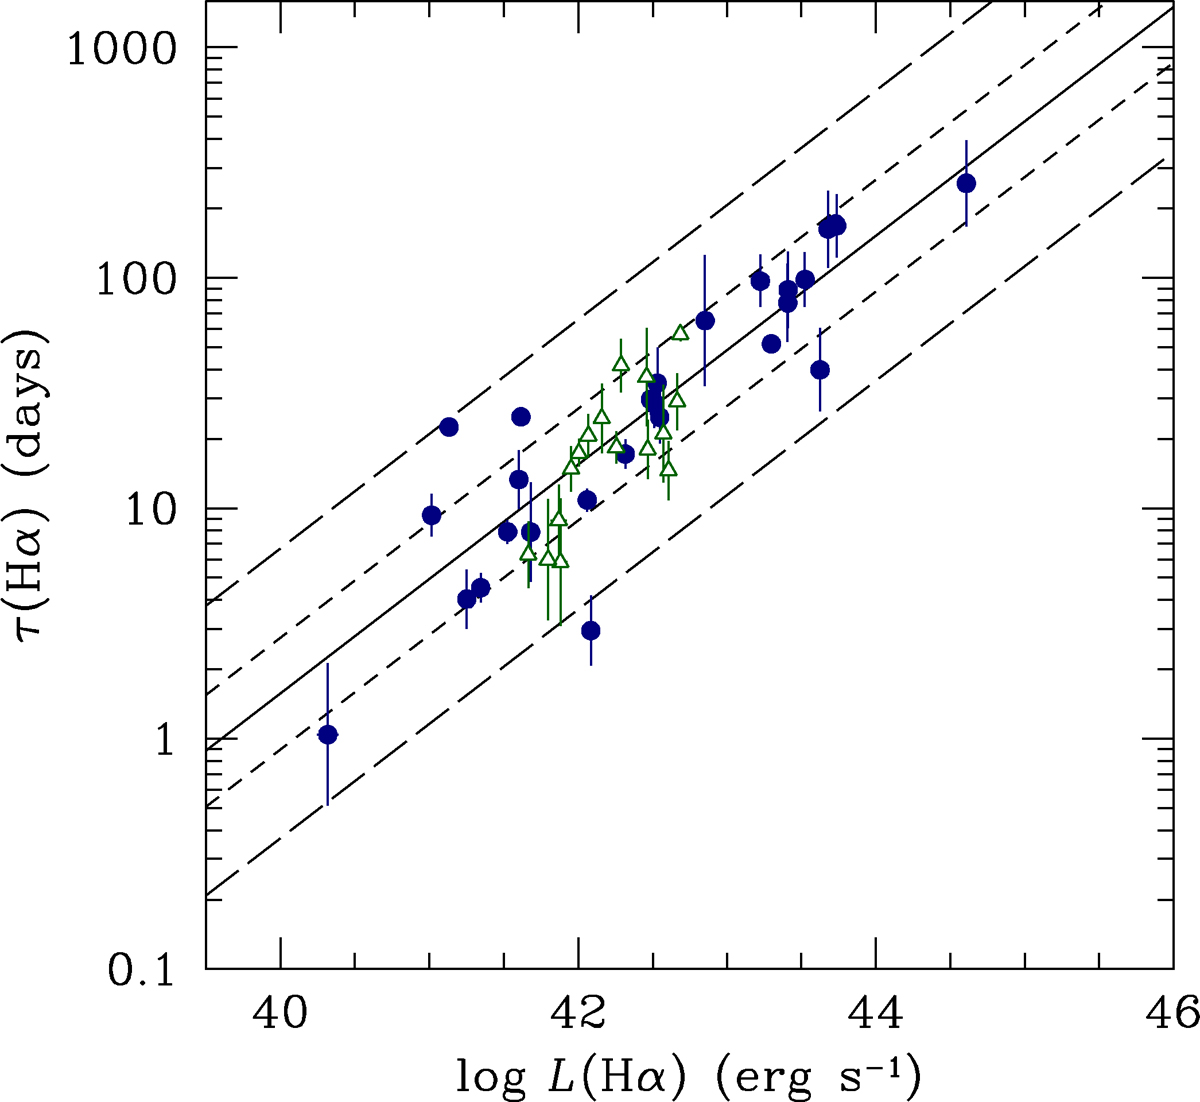
Fig. 2.
Download original image
Time-delayed response of the broad Hα line as as a function of Hα luminosity. Since the response time is directly related to the BLR radius by R = cτ, this is known as the R–L relationship. Blue circles are from the RM database (Table A.1) and green triangles are from SDSS-RM (Table B.1). The solid line shows the best fit to Eq. (2), with parameters given in the second line of Table 1. The short- and long-dashed line show the ±1σ and ±2.6σ envelopes, respectively.
Current usage metrics show cumulative count of Article Views (full-text article views including HTML views, PDF and ePub downloads, according to the available data) and Abstracts Views on Vision4Press platform.
Data correspond to usage on the plateform after 2015. The current usage metrics is available 48-96 hours after online publication and is updated daily on week days.
Initial download of the metrics may take a while.