Fig. 1.
Download original image
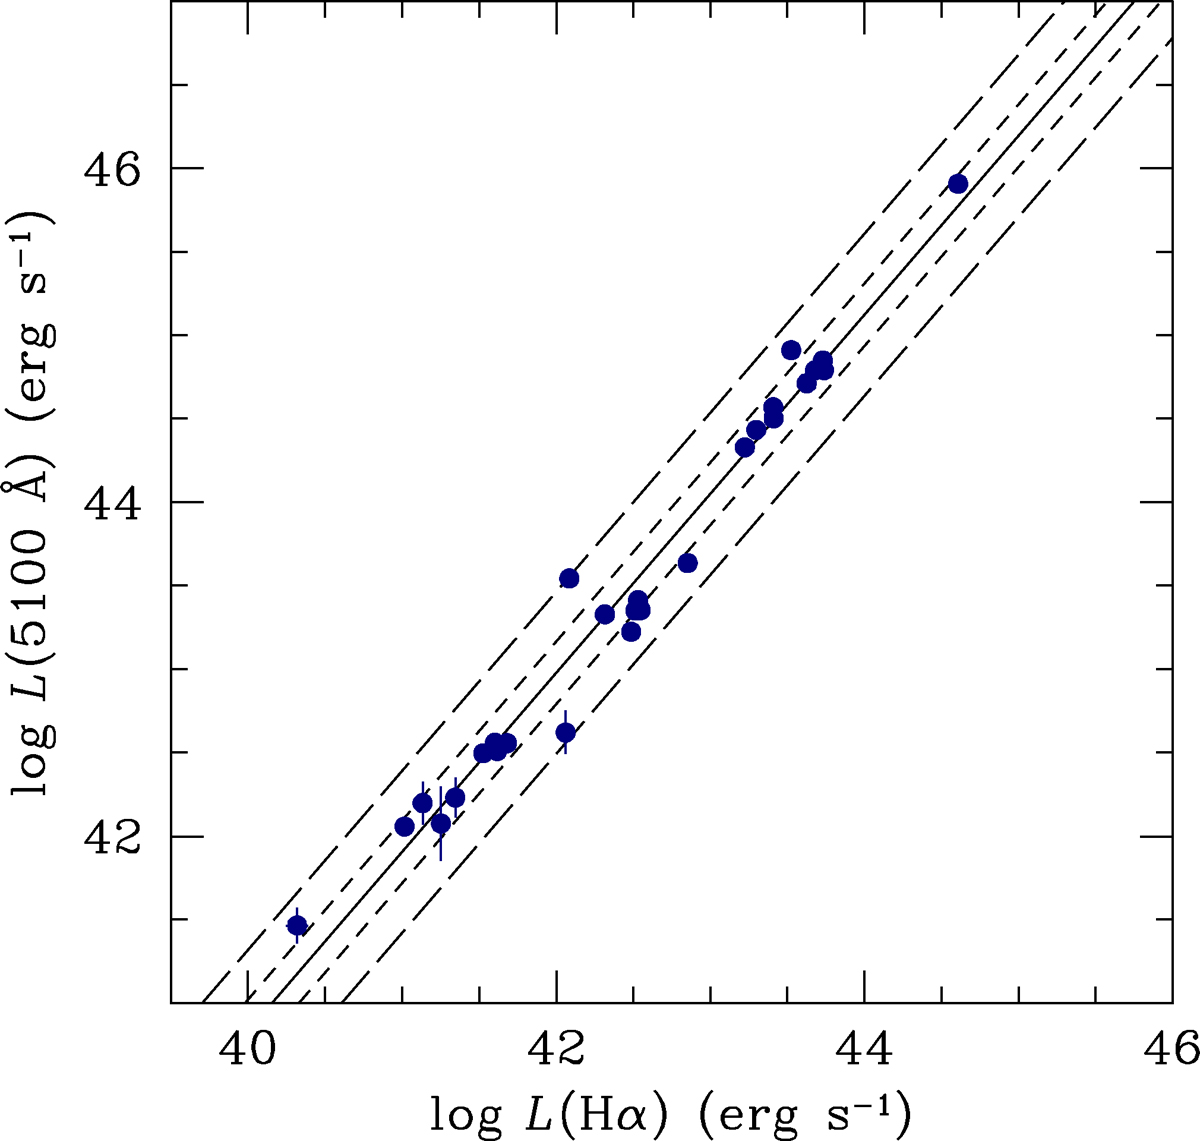
Correlation between the luminosity of the broad Hα emission line and the starlight-corrected AGN continuum luminosity at 5100 Å. Only AGNs with host-galaxy starlight removal from the measured continuum based on HST high-resolution imaging are shown (Bentz et al. 2013), i.e. the AGNs listed in Table 1. The solid line represents the best fit to Eq. (2), with parameters given in line 1 of Table 1. The short-dash lines show the ±1σ envelope, and the long-dash lines show the ±2.6σ (99% confidence level) envelope.
Current usage metrics show cumulative count of Article Views (full-text article views including HTML views, PDF and ePub downloads, according to the available data) and Abstracts Views on Vision4Press platform.
Data correspond to usage on the plateform after 2015. The current usage metrics is available 48-96 hours after online publication and is updated daily on week days.
Initial download of the metrics may take a while.