Fig. 9
Download original image
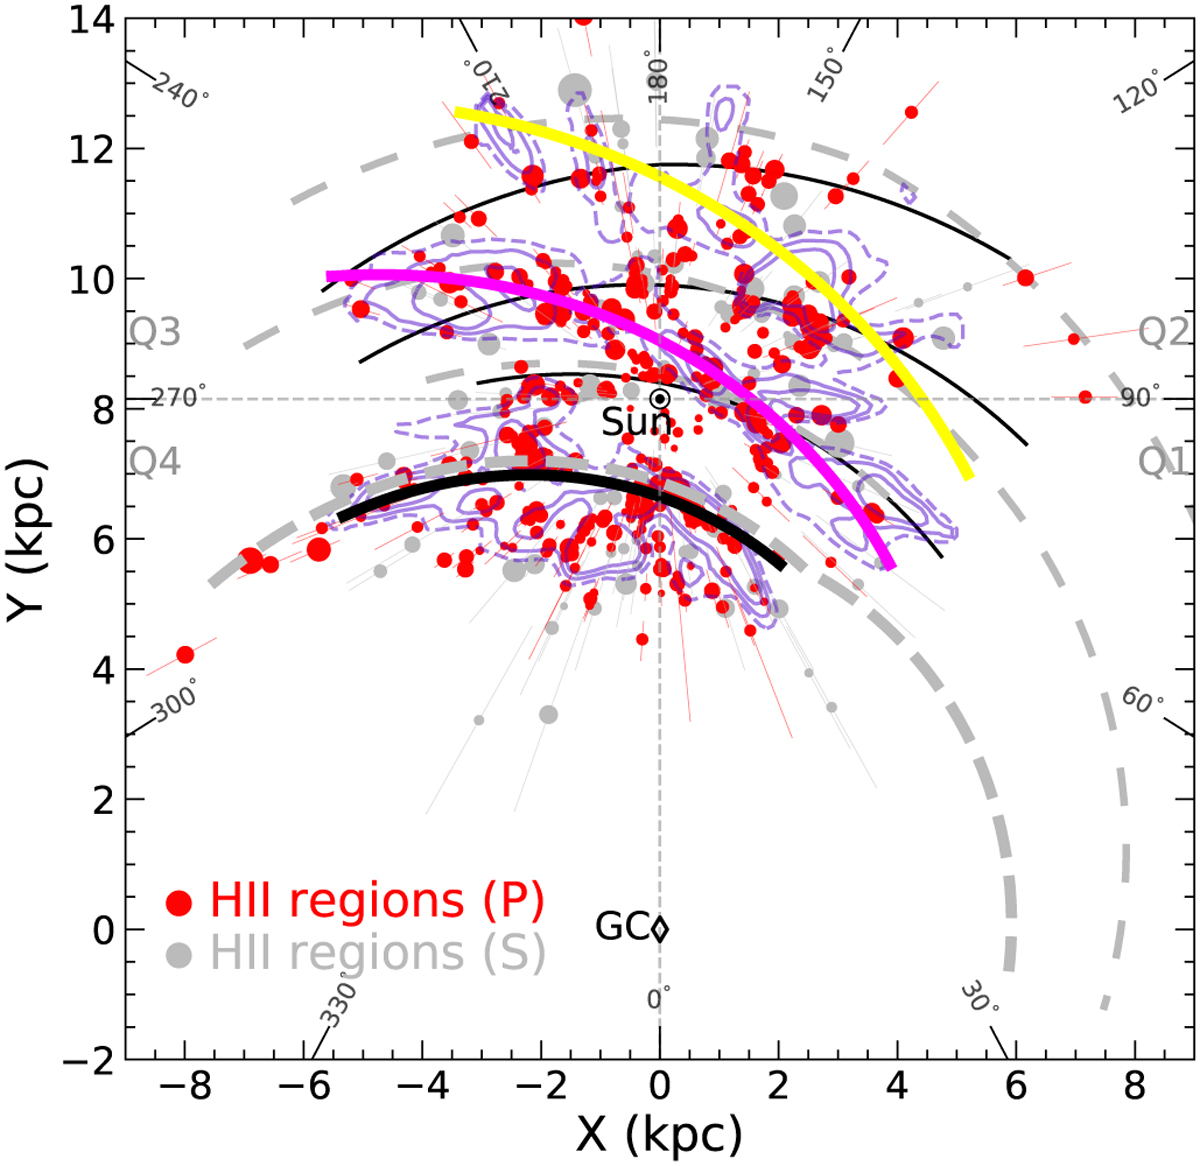
Distributions of H II regions overlaid with the corresponding spiral arm models. The fuchsia solid line traces the best-fitted Local Arm given by this work (see Section 4.2). The yellow curved line presents the Perseus Arm determined from the perturbed surface density map of H I by Levine et al. (2006). The solid and long-dashed curved lines in the plot indicate the best-fitted Carina/Sagittarius-Carina Arm (thick) and the other arm segments (thin) given by Xu et al. (2023) and Reid et al. (2019), respectively. H II regions and the positions of the Sun and GC are the same as Fig. 6. The overdensity map of evolved stars (blue) is also shown in the plot to make a comparison.
Current usage metrics show cumulative count of Article Views (full-text article views including HTML views, PDF and ePub downloads, according to the available data) and Abstracts Views on Vision4Press platform.
Data correspond to usage on the plateform after 2015. The current usage metrics is available 48-96 hours after online publication and is updated daily on week days.
Initial download of the metrics may take a while.