Fig. 8
Download original image
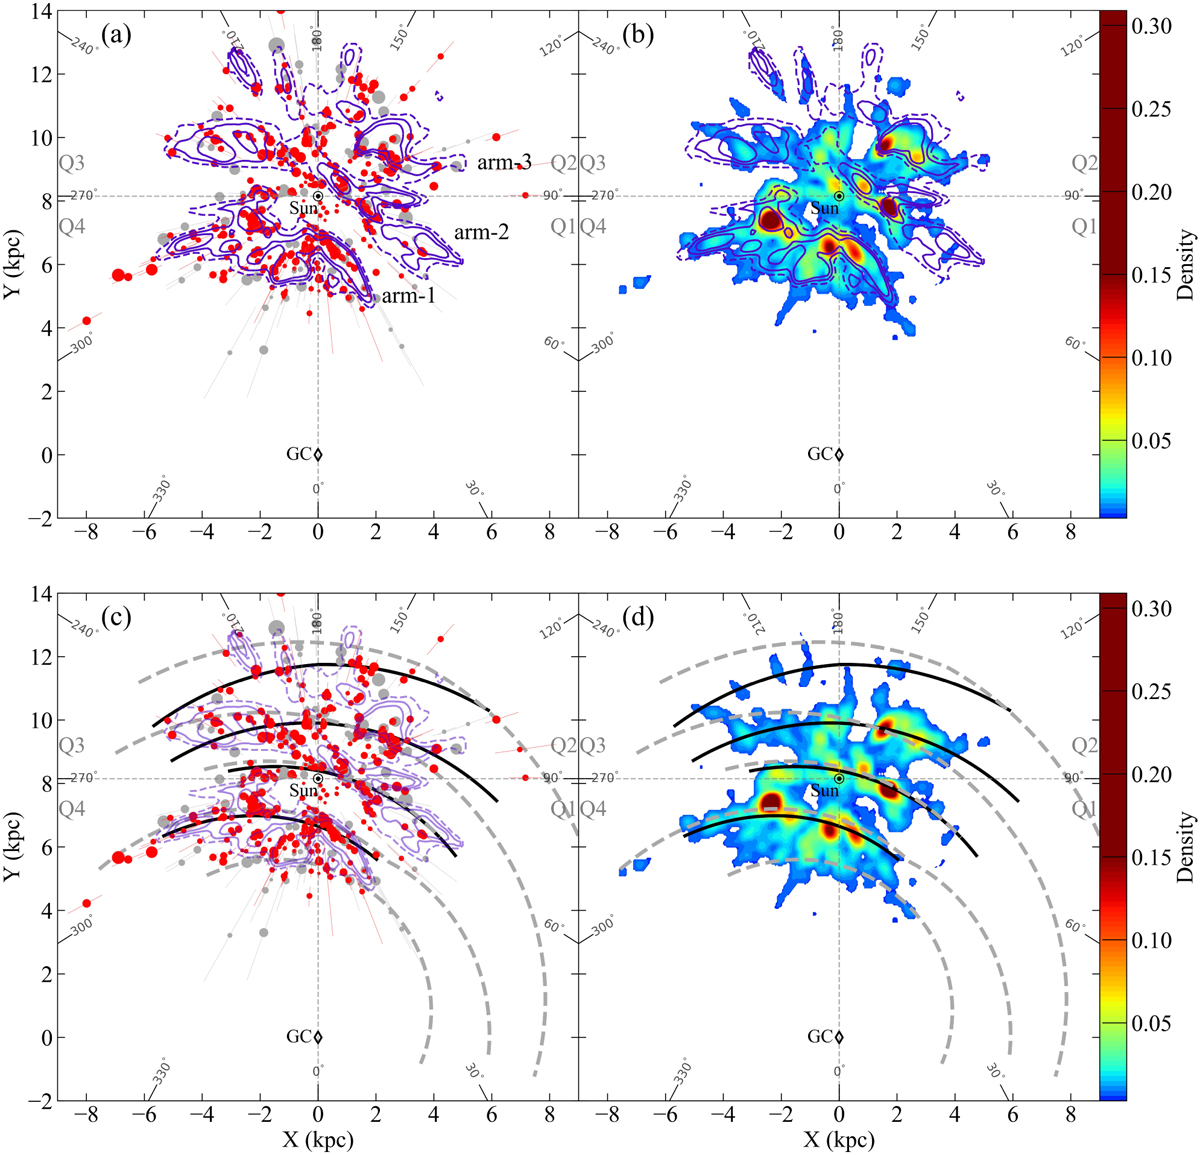
Top two panels: spatial distribution of H II regions (a), and the density map of young objects (b). The contours in panels (a), (b), and (c) represent the overdensity map of upper main-sequence stars (Poggio et al. 2021). The contour levels are 0 for the dashed line, as well as 0.2 and 0.4 for solid lines. Additionally, three arm-like features identified by Poggio et al. (2021) are labelled in panel (a) as arm-1, arm-2, and arm-3 from the inner to the outer Galactic disc. Bottom two panels: similar to the upper panels, but the results are overplotted on the spiral arm models of Xu et al. (2023, black solid lines) and Reid et al. (2019, grey dashed lines). The arm segments are the Outer Arm, the Perseus Arm, the Local Arm, the Carina/Sagittarius-Carina Arm, and the Scutum Arm from the outer to the inner Galactic disc.
Current usage metrics show cumulative count of Article Views (full-text article views including HTML views, PDF and ePub downloads, according to the available data) and Abstracts Views on Vision4Press platform.
Data correspond to usage on the plateform after 2015. The current usage metrics is available 48-96 hours after online publication and is updated daily on week days.
Initial download of the metrics may take a while.