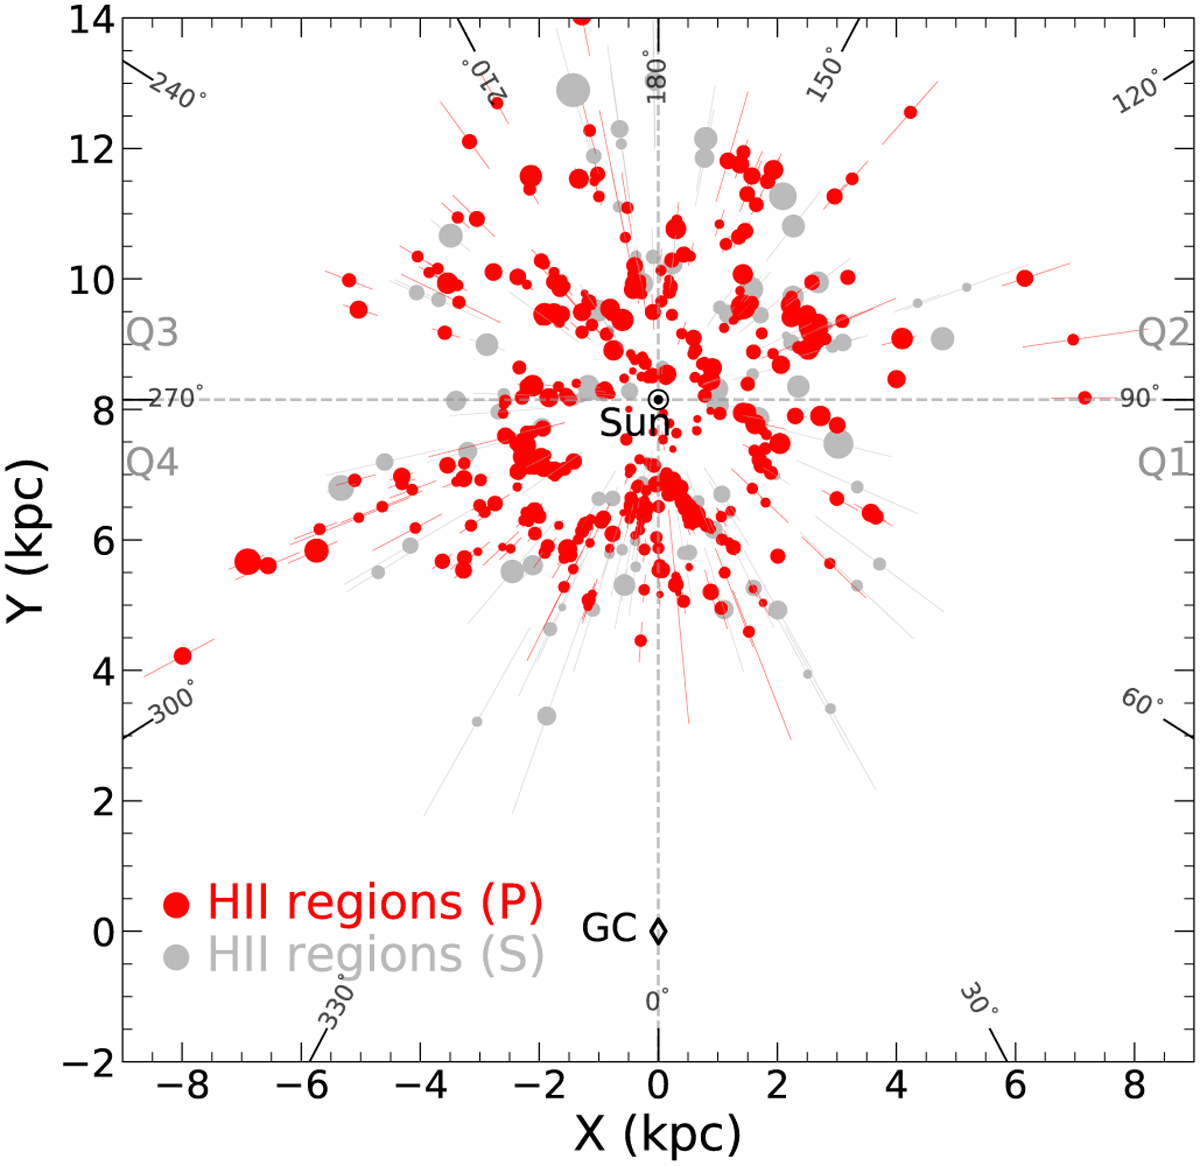
Fig. 6
Download original image
Distributions of 572 H II regions (Sect. 4.1) with accurate distances projected onto the Galactic disc. The H II regions with parallax-based (P) distances are shown by red dots, while those with spectrophotometric (S) distances are indicated by grey dots. Also shown in the plot are the distance uncertainties (underlying line segments). The dot size is proportional to the estimated radio luminosity of the H II region at 5 GHz. The positions of the Sun and GC are the same as the lower panel of Fig. 5.
Current usage metrics show cumulative count of Article Views (full-text article views including HTML views, PDF and ePub downloads, according to the available data) and Abstracts Views on Vision4Press platform.
Data correspond to usage on the plateform after 2015. The current usage metrics is available 48-96 hours after online publication and is updated daily on week days.
Initial download of the metrics may take a while.