Fig. 5
Download original image
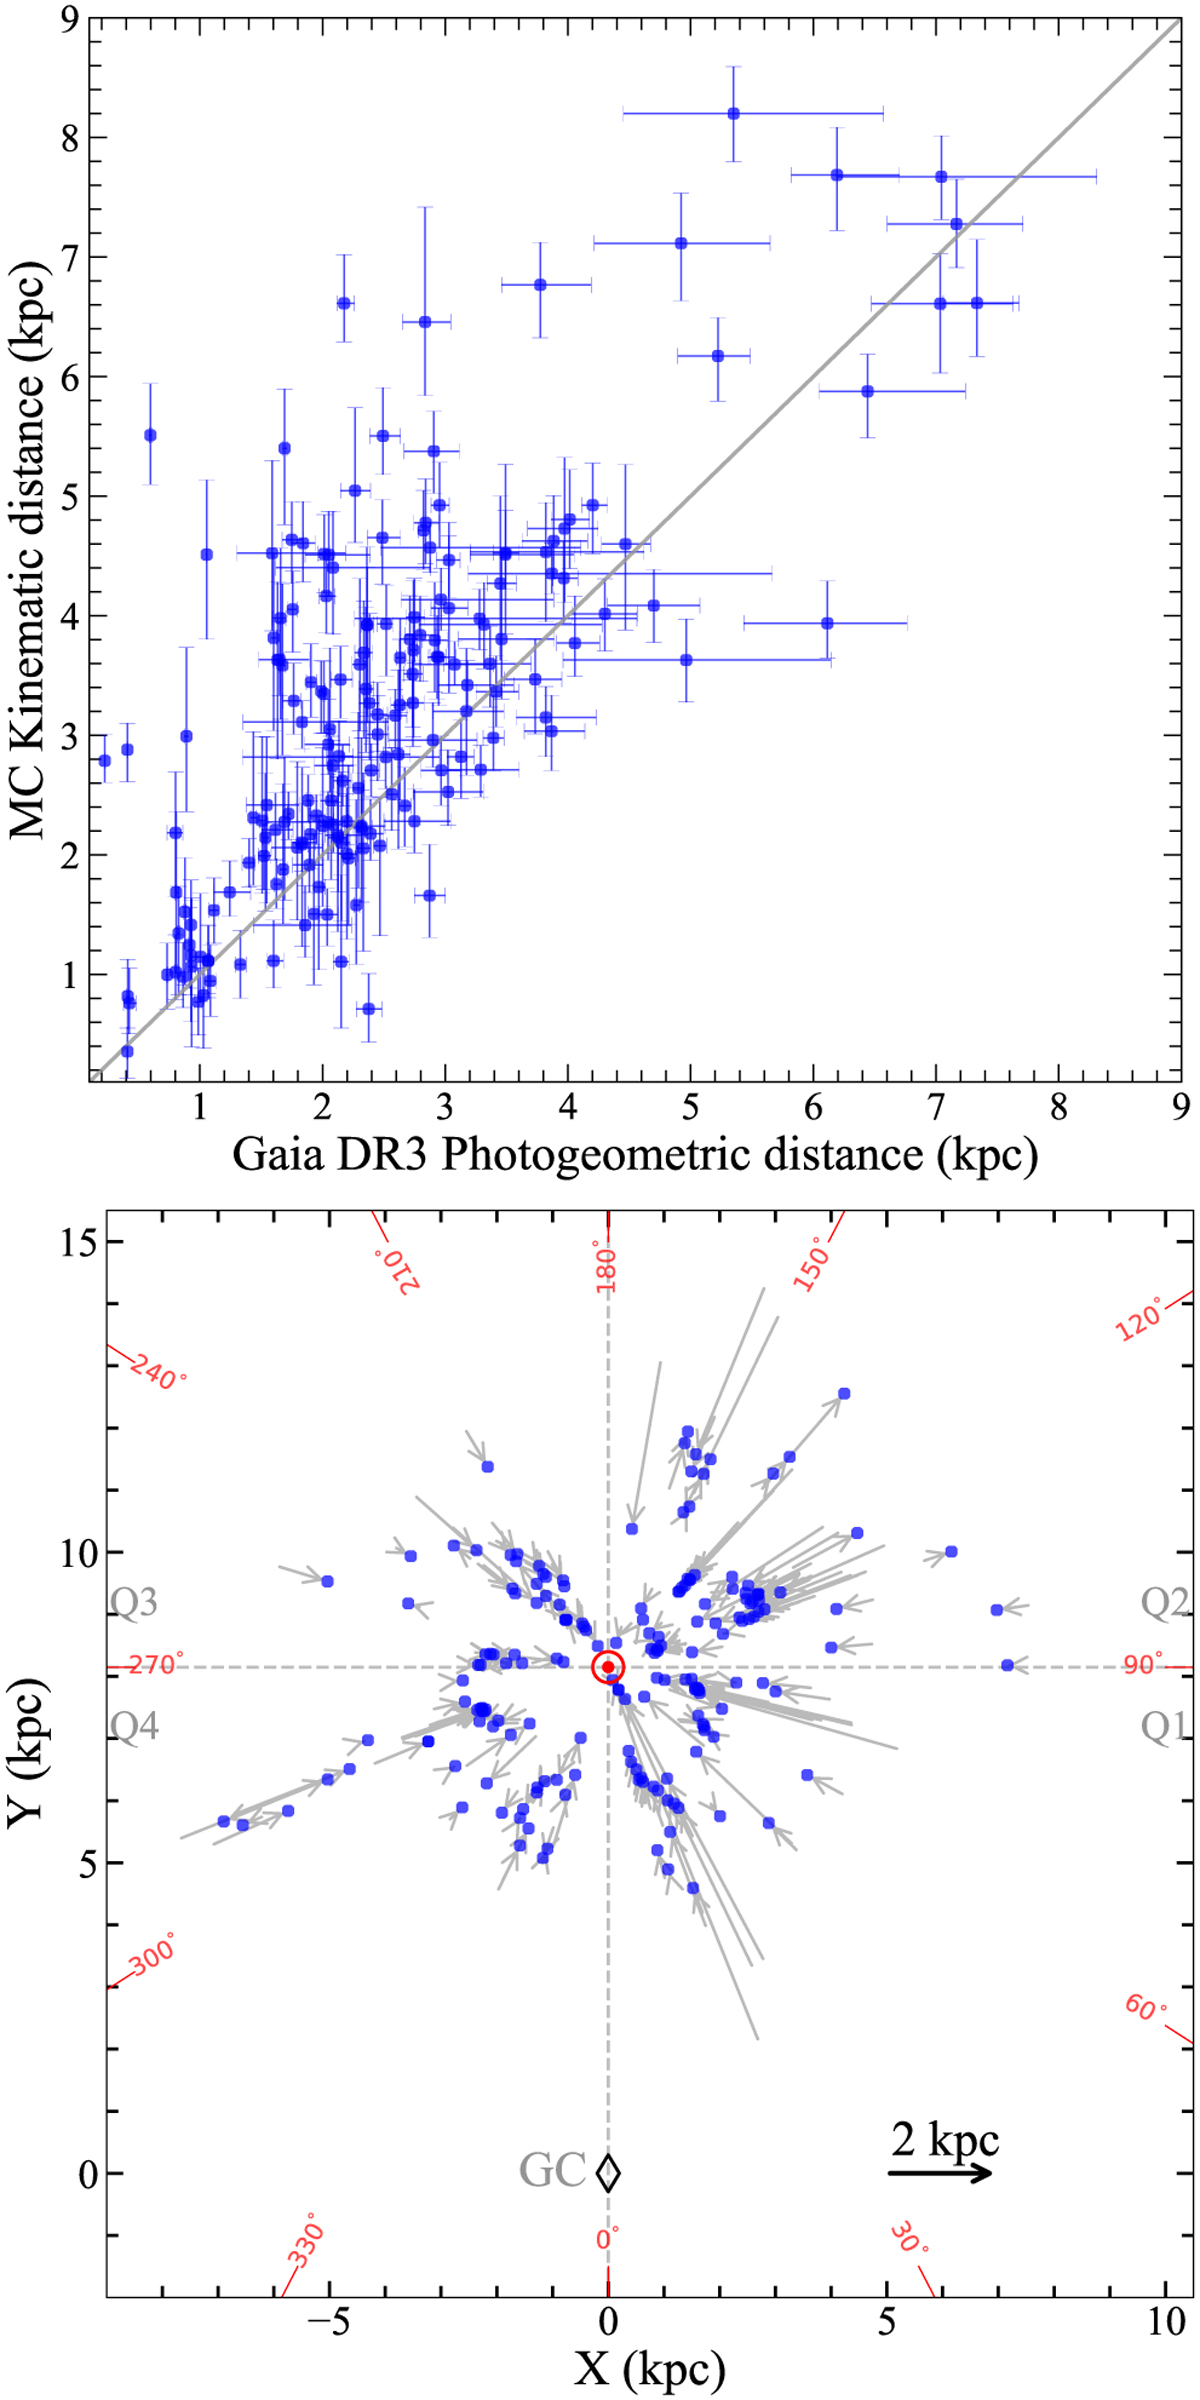
Upper: comparison between the parallax-based distances of H II regions given by this work and the kinematic distances. The grey line is the equal line. Lower: distributions of the H II regions projected onto the Galactic disc, to better show the influence of updated distance parameters on the delineated spiral arm segments. The starting point and ending point of each arrow represent the positions of an H II region according to the kinematic distance and the parallax-based distance, respectively. The locations of H II regions based on the parallax distances are marked with blue dots. In the plot, the Sun is at (0, 8.15) kpc (Reid et al. 2019), while the Galactic Centre is at (0.0, 0.0) kpc. Q1–Q4 indicate the four Galactic quadrants.
Current usage metrics show cumulative count of Article Views (full-text article views including HTML views, PDF and ePub downloads, according to the available data) and Abstracts Views on Vision4Press platform.
Data correspond to usage on the plateform after 2015. The current usage metrics is available 48-96 hours after online publication and is updated daily on week days.
Initial download of the metrics may take a while.