Fig. 2
Download original image
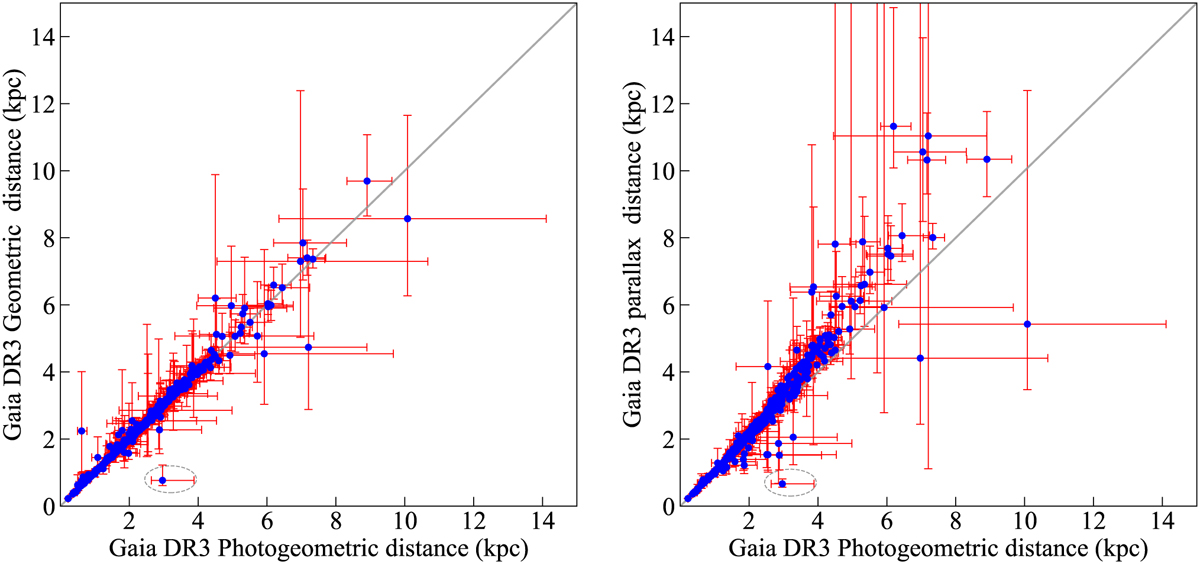
Comparison of the photogeometric distances of the 459 H II regions with the other two types of distance determined from the Gaia DR3. Left: photogeometric distance versus geometric distance. Right: photogeometric distance versus inverse parallax. The grey line in each panel represents the equal line. The grey dashed ellipse denotes the H II region G331.172-00.460 (see Sect. 3.2).
Current usage metrics show cumulative count of Article Views (full-text article views including HTML views, PDF and ePub downloads, according to the available data) and Abstracts Views on Vision4Press platform.
Data correspond to usage on the plateform after 2015. The current usage metrics is available 48-96 hours after online publication and is updated daily on week days.
Initial download of the metrics may take a while.