Fig. 1
Download original image
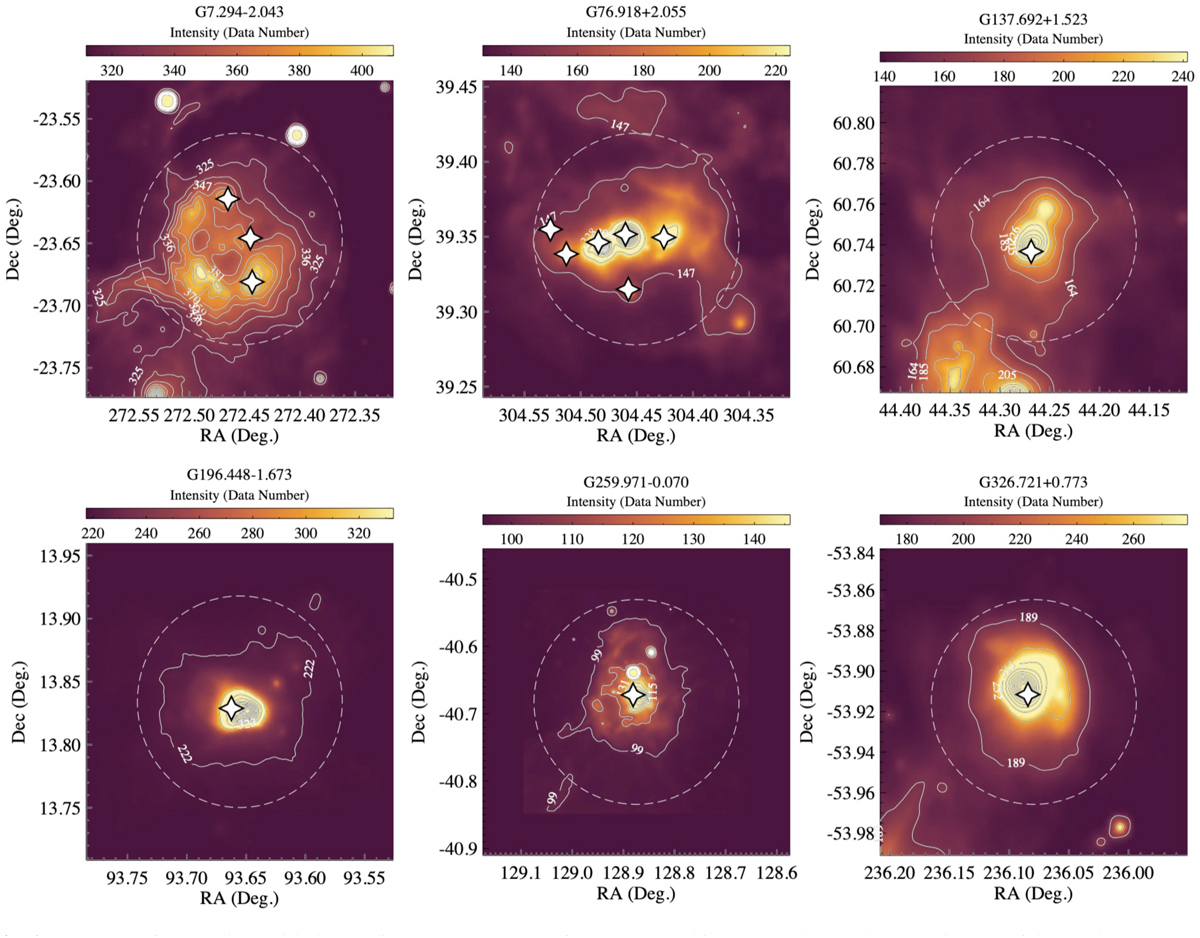
Examples of H II regions with the candidate counterpart(s) of O-B2 stars (white star symbols). The WISE images of the W4 band (22 µm, colour maps) are shown as backgrounds. The contour levels with the corresponding data numbers (white) are marked in each panel, and the first level is adopted to indicate the H II region boundary (see Sect. 3.1). The dashed circle in each plot is the size of the H II region determined from the angular radius parameter given by the WISE H II region catalogue (Anderson et al. 2014).
Current usage metrics show cumulative count of Article Views (full-text article views including HTML views, PDF and ePub downloads, according to the available data) and Abstracts Views on Vision4Press platform.
Data correspond to usage on the plateform after 2015. The current usage metrics is available 48-96 hours after online publication and is updated daily on week days.
Initial download of the metrics may take a while.