Fig. 9
Download original image
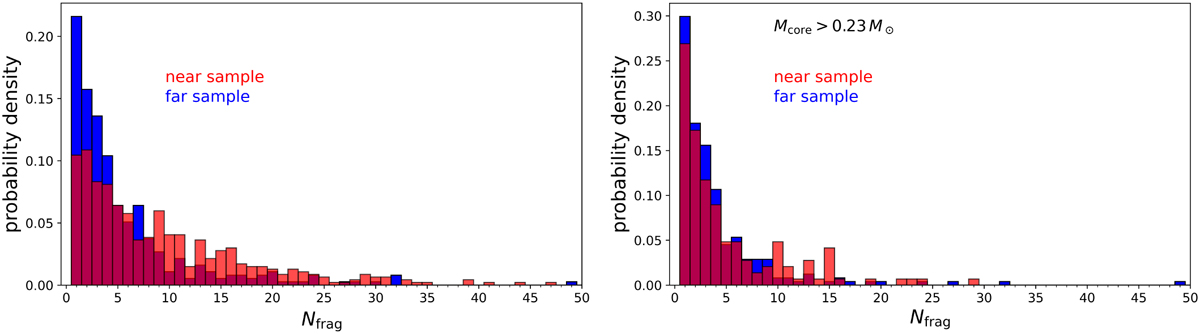
Fragmentation statistics evaluated for near sample and far sample sources separately. Left panel: probability density distribution of the number of cores detected in each clump for near sample (red bars) and far sample (blue bars) sources, respectively. Right panel: same as left panel, but only including clumps containing core masses above 0.23 M⊙ (see text for interpretation). Detailed statistics for the individual distributions are reported in Table 5.
Current usage metrics show cumulative count of Article Views (full-text article views including HTML views, PDF and ePub downloads, according to the available data) and Abstracts Views on Vision4Press platform.
Data correspond to usage on the plateform after 2015. The current usage metrics is available 48-96 hours after online publication and is updated daily on week days.
Initial download of the metrics may take a while.