Fig. 8
Download original image
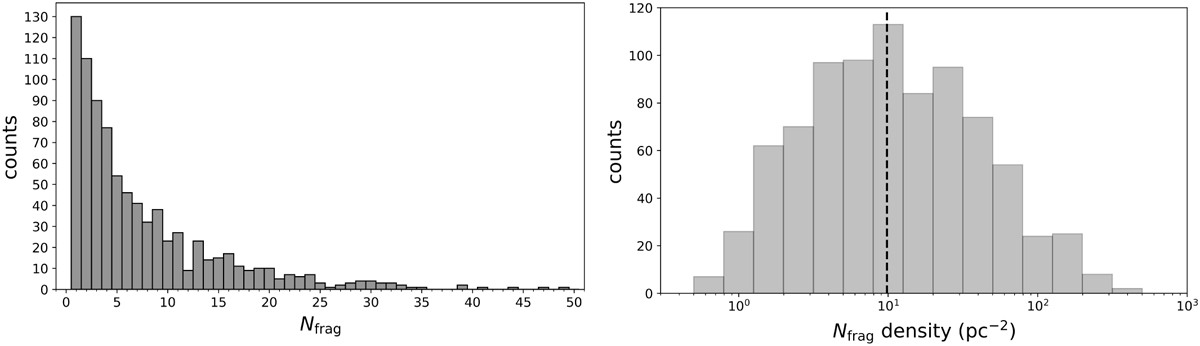
Fragmentation statistics deduced from the compact source catalog (Table 3). Left panel: overall distribution of the number of cores detected in each clump; detailed statistics are reported in Table 4. Right panel: overall distribution of the derived spatial density of the cores in each clump, computed within the entire FOV. The vertical dashed black line marks the median value of ∼10 pc−2 . In both panels, only clumps revealing at least 1 detection are included.
Current usage metrics show cumulative count of Article Views (full-text article views including HTML views, PDF and ePub downloads, according to the available data) and Abstracts Views on Vision4Press platform.
Data correspond to usage on the plateform after 2015. The current usage metrics is available 48-96 hours after online publication and is updated daily on week days.
Initial download of the metrics may take a while.