Fig. 7
Download original image
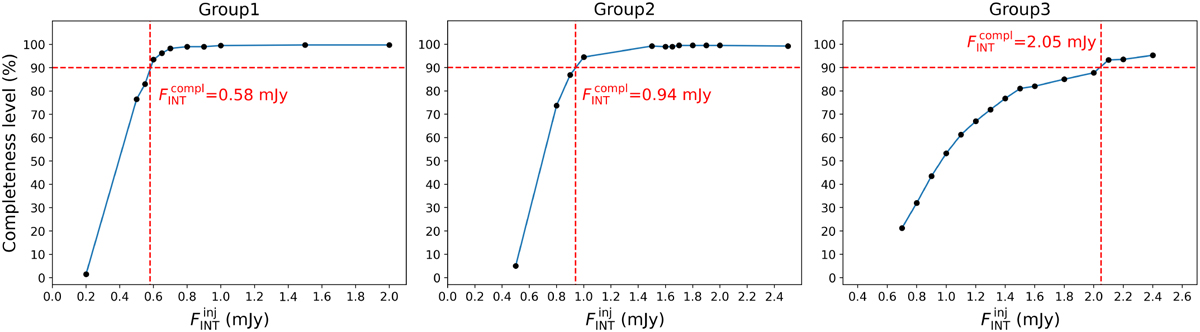
Completeness levels (i.e., percentage of detection) as a function of the “true” integrated flux of the synthetic sources injected into the maps ![]() for the three different groups of targets selected based on their rms noise, as introduced in Sect. 2.3: Group 1 (left panel), 2 (middle panel), and 3 (right panel), respectively. The two dashed red lines in each panel identify the estimated completeness flux,
for the three different groups of targets selected based on their rms noise, as introduced in Sect. 2.3: Group 1 (left panel), 2 (middle panel), and 3 (right panel), respectively. The two dashed red lines in each panel identify the estimated completeness flux, ![]() , which is reported in red.
, which is reported in red.
Current usage metrics show cumulative count of Article Views (full-text article views including HTML views, PDF and ePub downloads, according to the available data) and Abstracts Views on Vision4Press platform.
Data correspond to usage on the plateform after 2015. The current usage metrics is available 48-96 hours after online publication and is updated daily on week days.
Initial download of the metrics may take a while.