Open Access
Fig. 4
Download original image
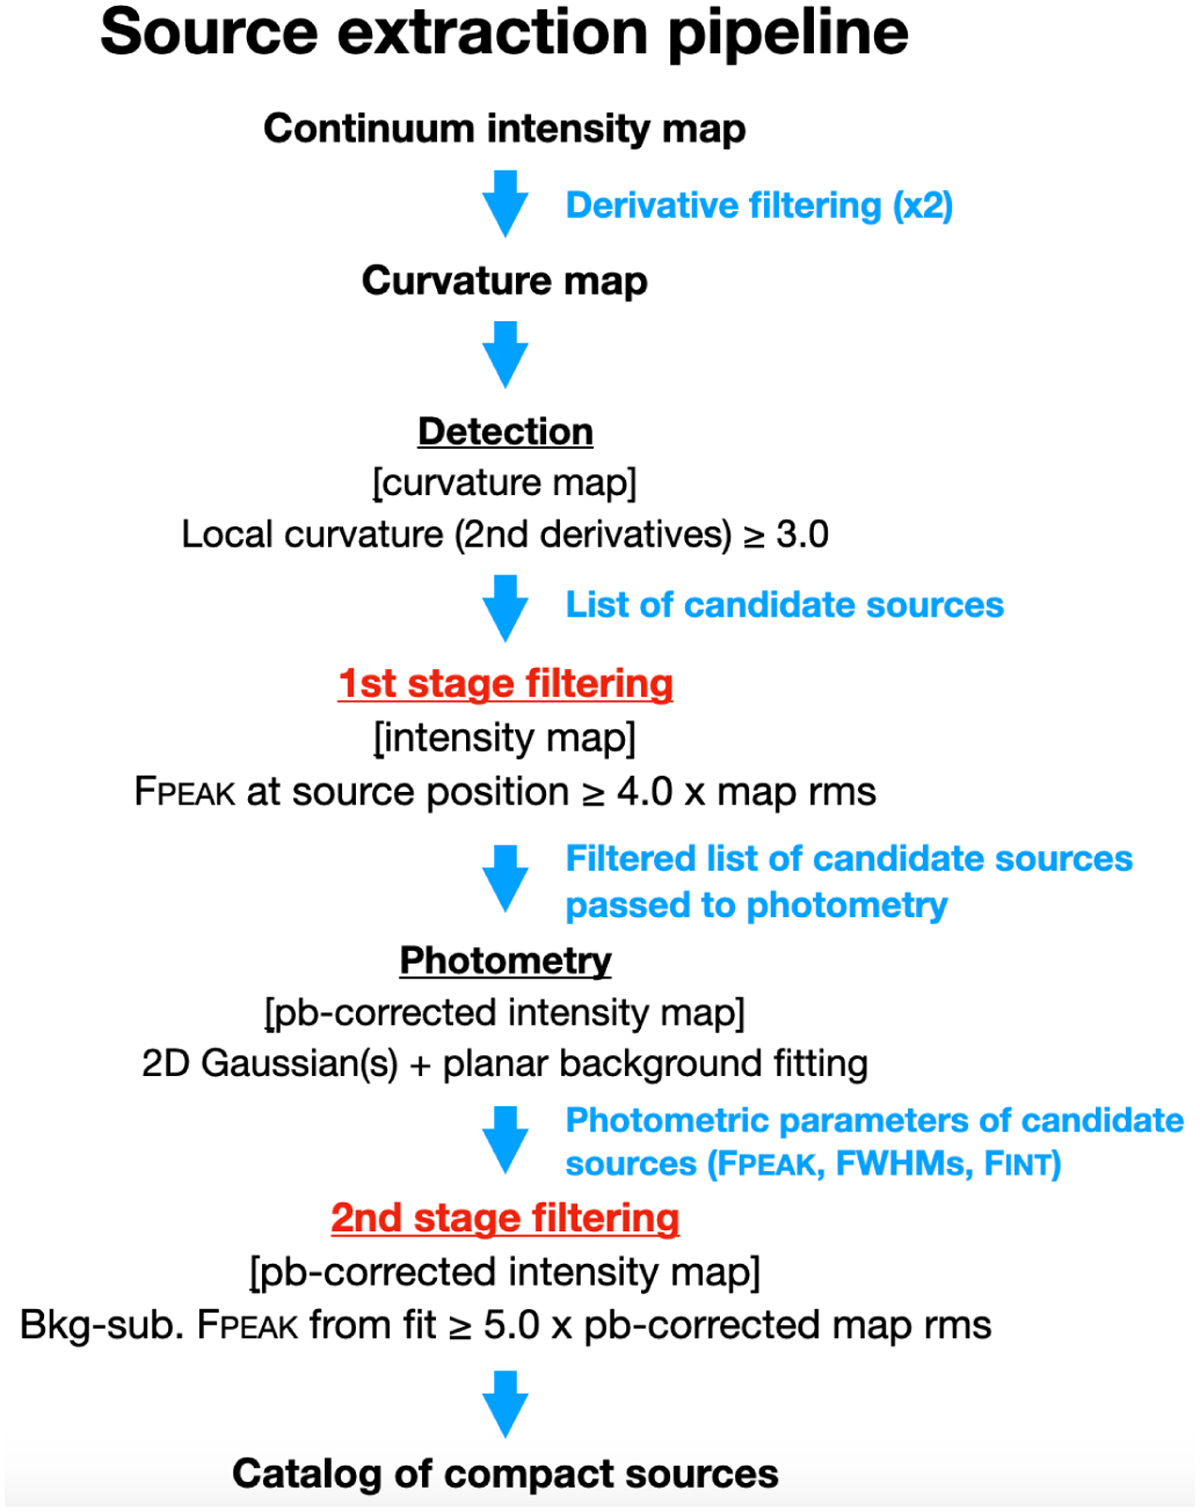
Diagram of the main phases of the source detection and photometry pipeline developed and used in this work. Underlined black steps were already present in the original CuTEx version (but were still further implemented in this work), while those in red have been newly introduced in the context of the present work.
Current usage metrics show cumulative count of Article Views (full-text article views including HTML views, PDF and ePub downloads, according to the available data) and Abstracts Views on Vision4Press platform.
Data correspond to usage on the plateform after 2015. The current usage metrics is available 48-96 hours after online publication and is updated daily on week days.
Initial download of the metrics may take a while.